Chapter 14 Results from each domain
After the exploratory and descriptive analysis plus the factor analysis, a set of items and their relationship with each domain were defined. In this regard, three factors were established including 14 items. Therefore, descriptive results for these items according each factor-domain are presented. Then, an exploratory analysis will be performed regarding the knowledge domain and sociodemographics.
14.1 Descriptive results by domain
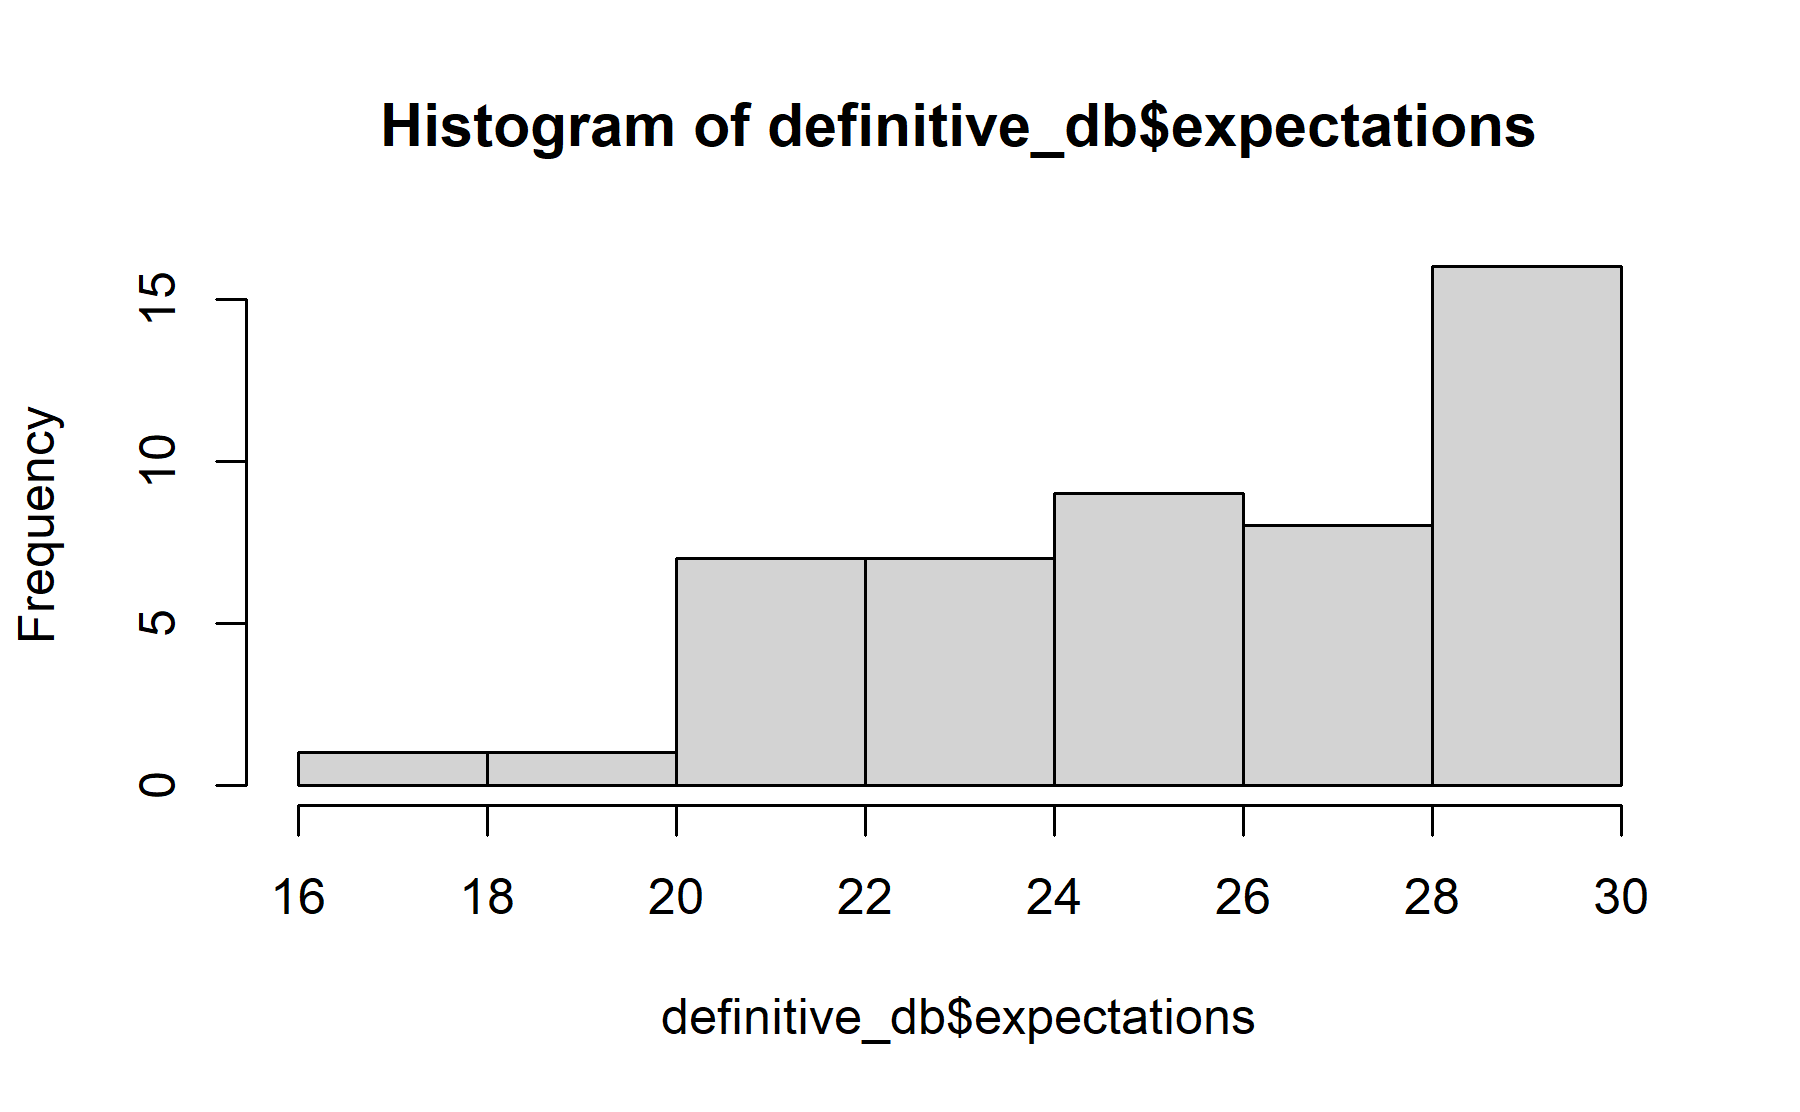
14.1.1 Expectations
First, expectations is presented. For this domain the following six items were included:
pre_exp_preoc_q5
pre_exp_preoc_q6
pre_exp_preoc_q7_i
pre_exp_preoc_q7_iv
pre_exp_preoc_q7_v
pre_actit_q4
| n | All_missing | Minimun | Maximun | Mean | DS | Median | FirstQ | ThirdQ | IQR |
|---|---|---|---|---|---|---|---|---|---|
| 50 | 1 | 17 | 30 | 26.18 | 3.383 | 26 | 23 | 30 | 7 |
Considering the fact that there are six items and all of them are positive and added in the same way, the possible range of values is extended from 0 to 30 (if some items are not answered). The lowest level for each question is 1 and the highest is 5.
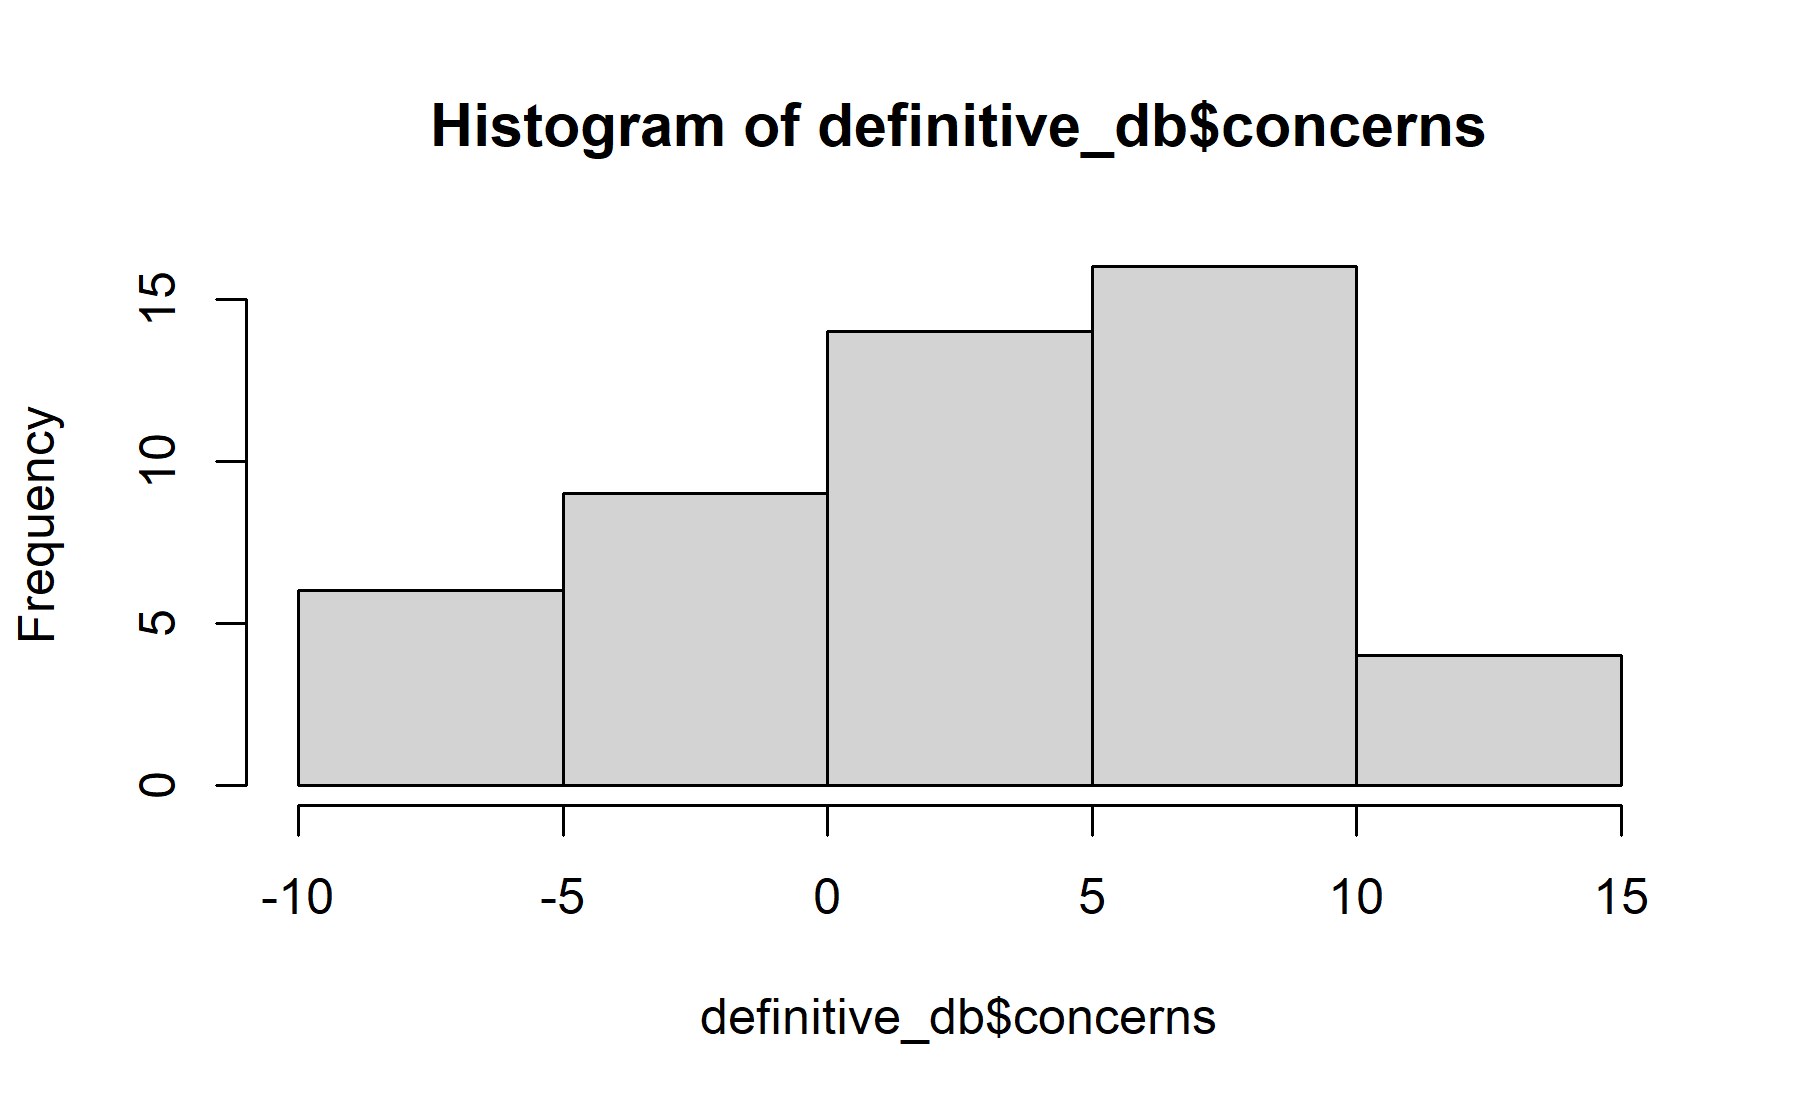
14.1.2 Concerns
Then, concerns is presented. For this domain the following items were included (in these set, two items play a inverse role with the domain (-)):
(-)pre_exp_preoc_q2
pre_exp_preoc_q8
pre_exp_preoc_q9
pre_exp_preoc_q10
pre_exp_preoc_q11
(-)pre_actit_q5_Inverted
| n | All_missing | Minimun | Maximun | Mean | DS | Median | FirstQ | ThirdQ | IQR |
|---|---|---|---|---|---|---|---|---|---|
| 50 | 1 | -8 | 12 | 3.163 | 5.437 | 3 | 0 | 7 | 7 |
Again all the items has a range between 1 and 5. However, in this setting two items are negatively correlated; thus, they subtract points to the total score. Therefore, the total range goes from -10 to 20 (if some items are not answered).
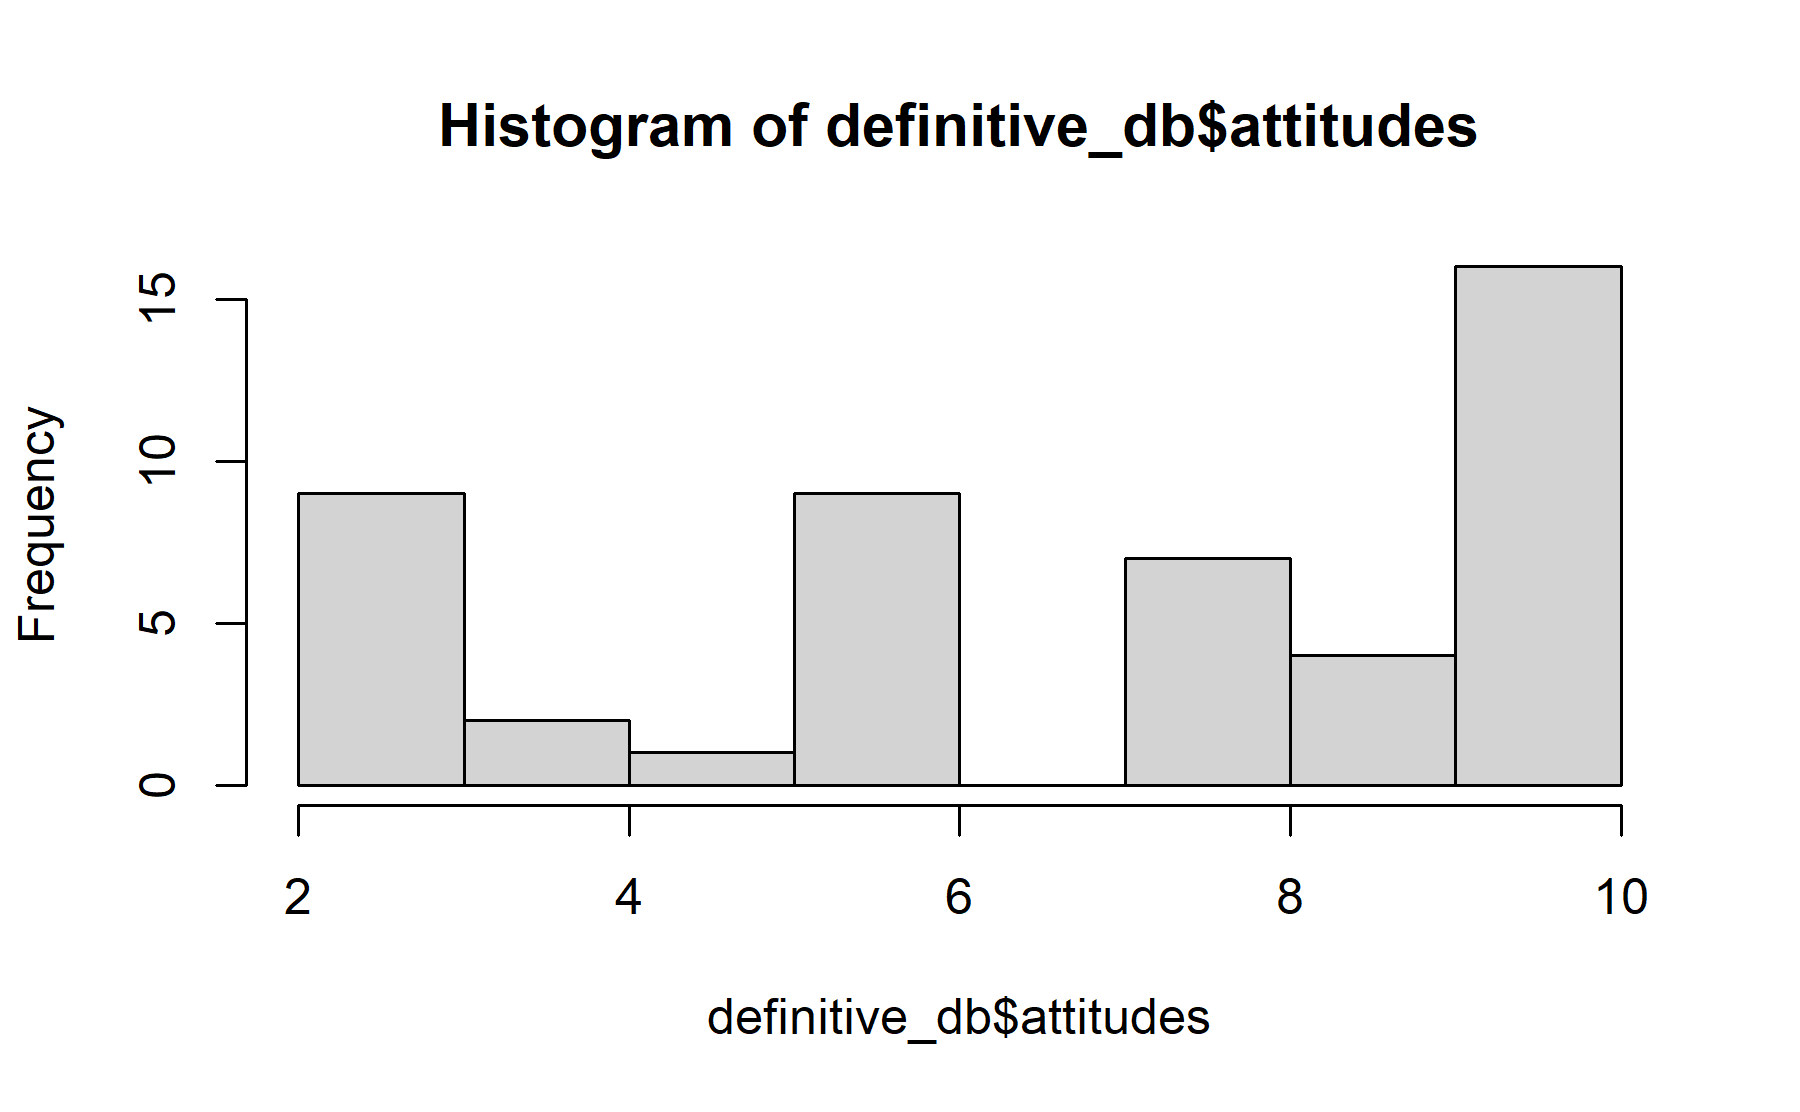
14.1.3 Attitudes
Finally, the attitudes domain is built upon two items, both positively correlated:
pre_actit_q2
pre_actit_q3
| n | All_missing | Minimun | Maximun | Mean | DS | Median | FirstQ | ThirdQ | IQR |
|---|---|---|---|---|---|---|---|---|---|
| 50 | 2 | 2 | 10 | 7.021 | 3 | 8 | 5.75 | 10 | 4.25 |
Considering the fact that there are six items and all of them are positive and added in the same way, the possible range of values is extended from 0 to 30 (if some items are not answered). The lowest level for each question is 1 and the highest is 5.
14.2 Relatioship between domains and knowledge
14.2.1 Description of knowledge score
According to the prior analysis 5 items were considered to maintain in the definitive questionnaire. These five items are:
Q1
Q3
Q5
Q7
Q8
Therefore, a descriptive summary is presented for these items. The high score for each item is 1, with 0 or 1 for four of them (Q1, Q5, Q7, and Q8), and five levels according to the options available for Q3 (0, 0.2, 0.4, 0.6, 0.8, 1).
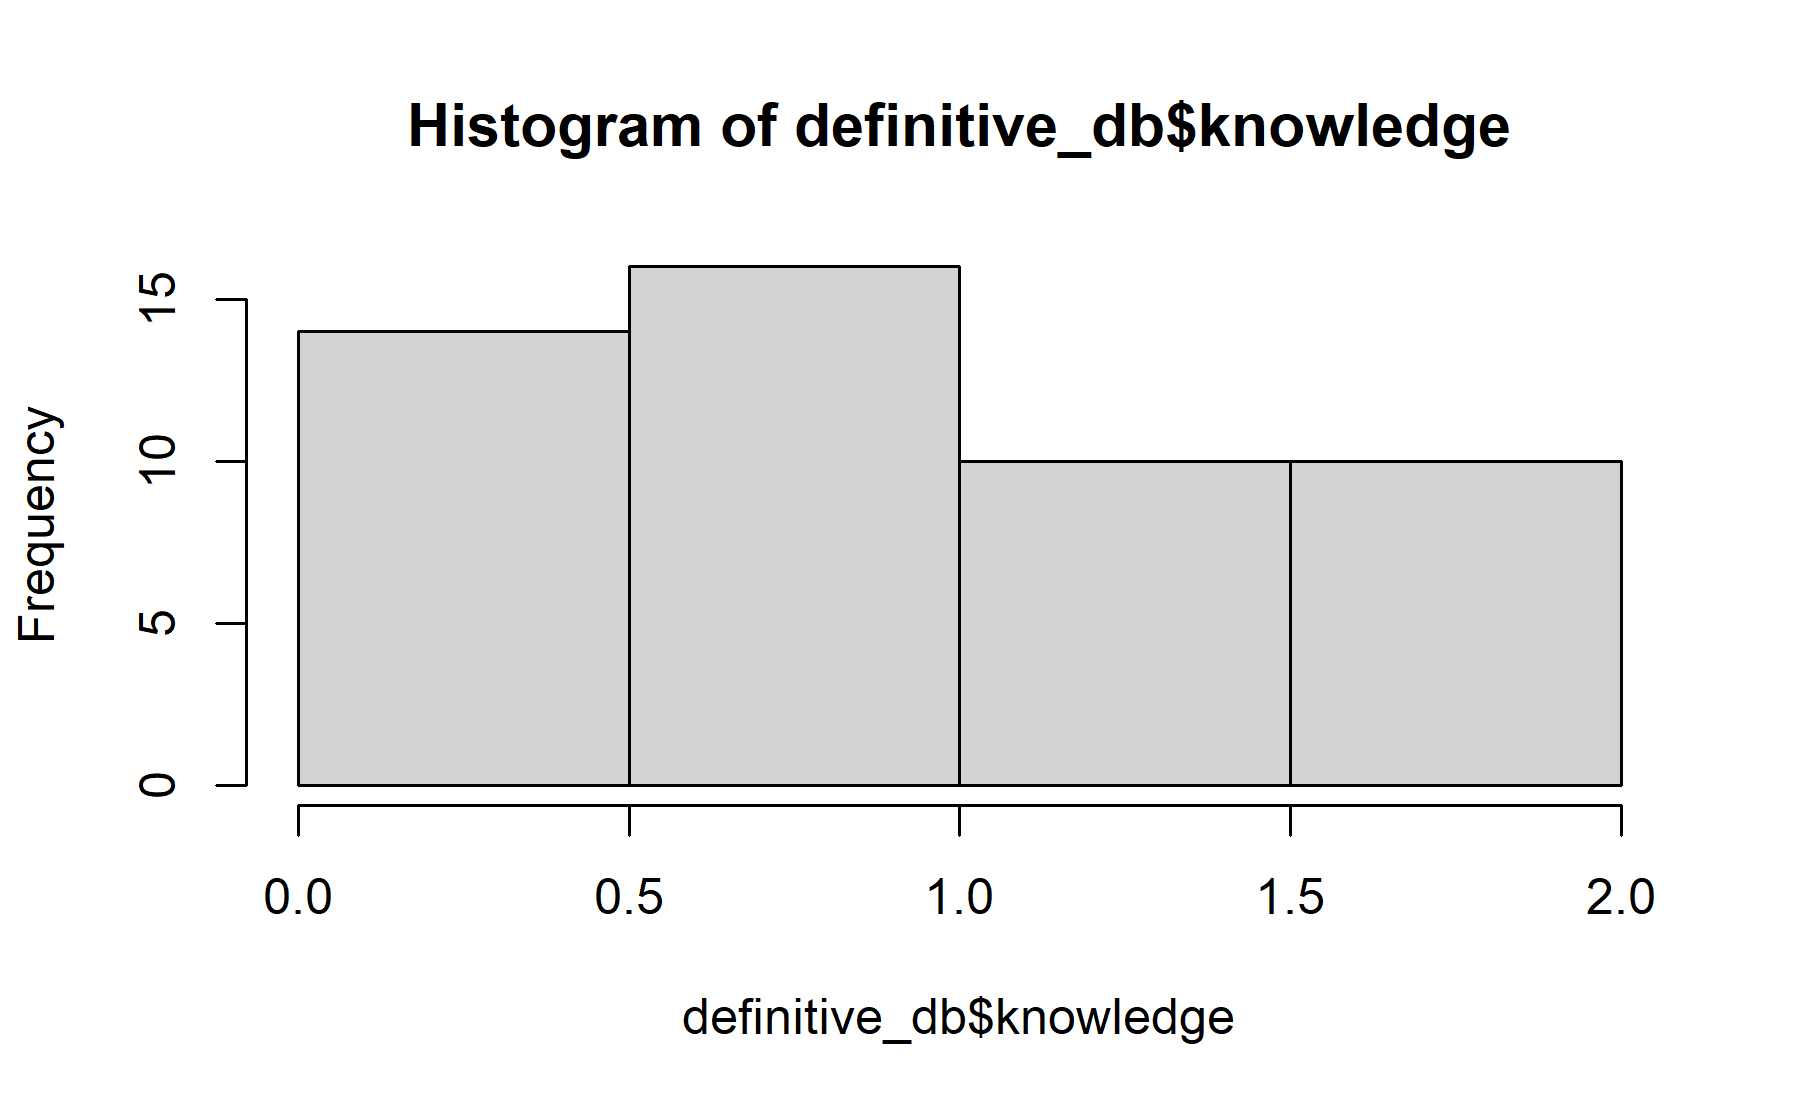
| n | All_missing | Minimun | Maximun | Mean | DS | Median | FirstQ | ThirdQ | IQR |
|---|---|---|---|---|---|---|---|---|---|
| 50 | 0 | 0 | 2 | 0.96 | 0.5642 | 1 | 0.4 | 1.4 | 1 |
14.2.2 Association between knowledge score and each domain
The relationship between knowledge and expectations is analyzed.
## Warning: Removed 1 rows containing missing values (`geom_point()`).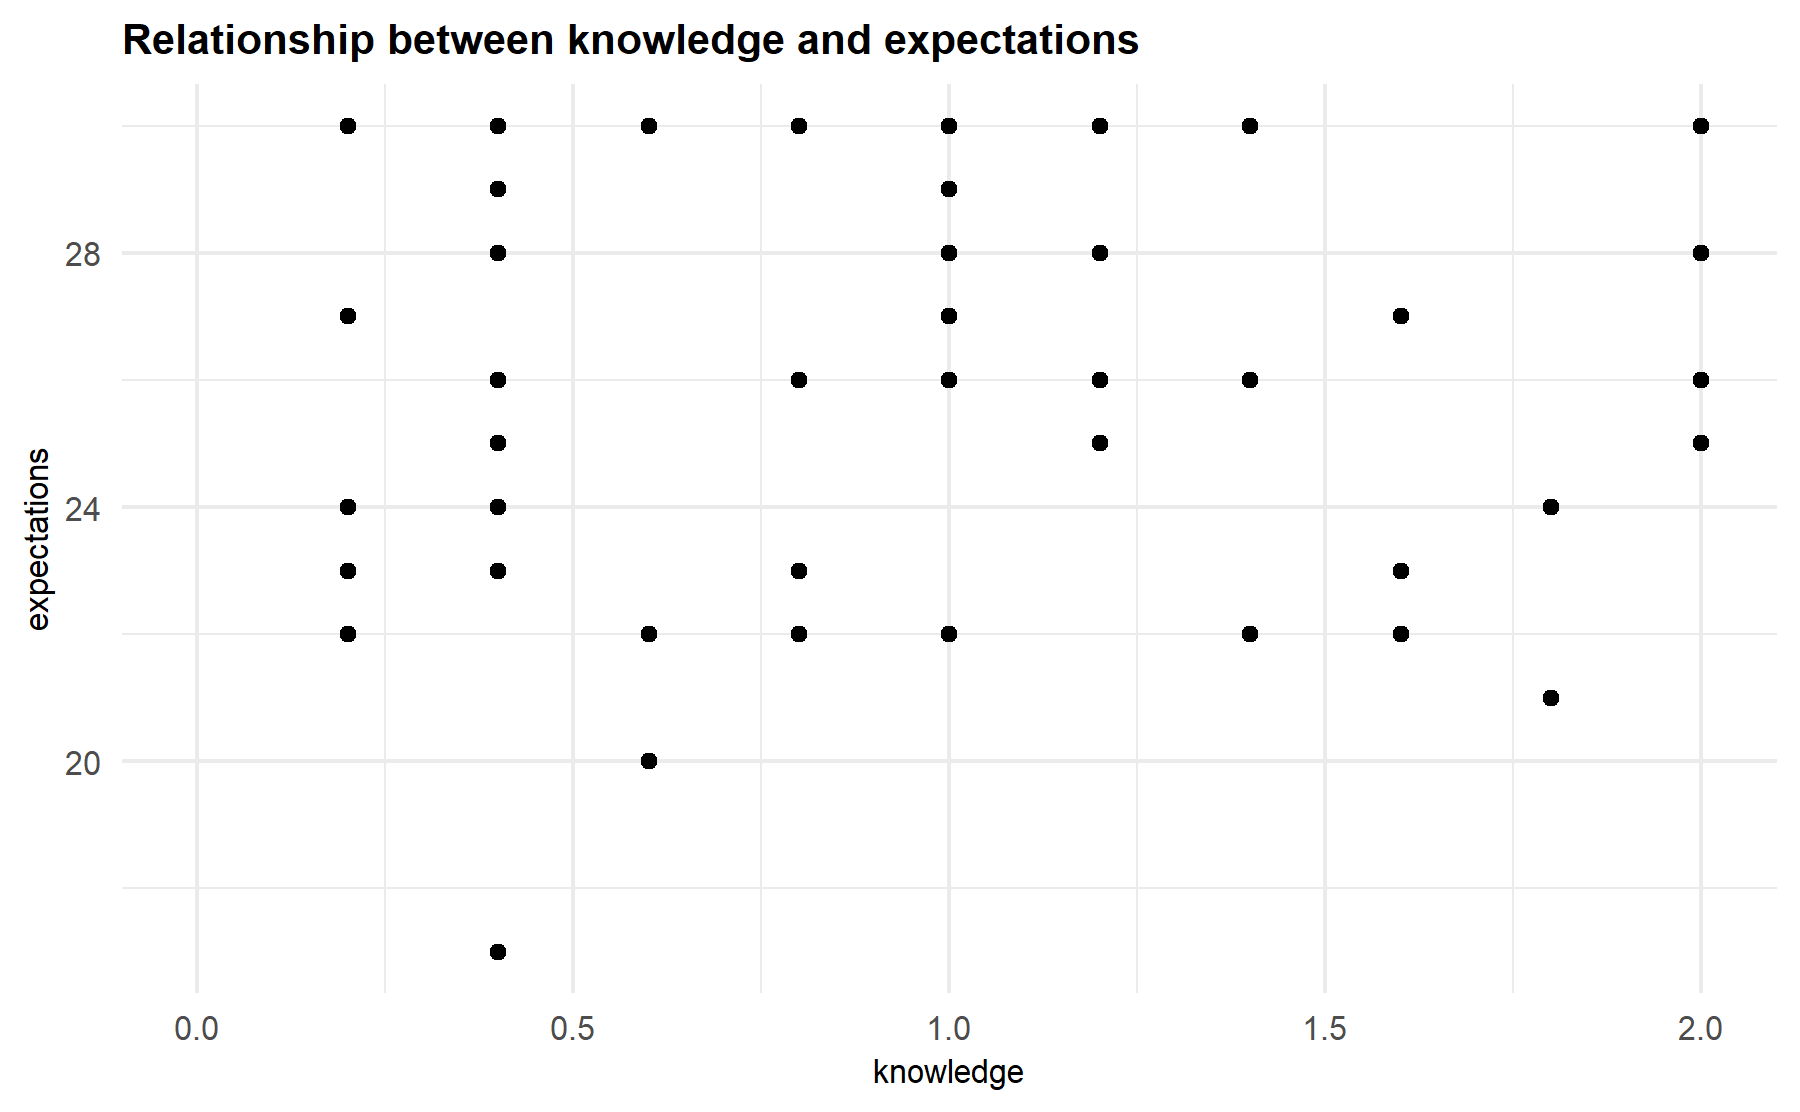 There is not a clear linear relationship between both variables. Then, in order to compare between two knowledge groups, a categorization is made. For this purpose, the knowledge score will be split into two levels considering the median score (median <= 1 or above).
## Warning: Removed 1 rows containing non-finite values (`stat_boxplot()`).## Warning: Removed 1 rows containing missing values (`geom_point()`).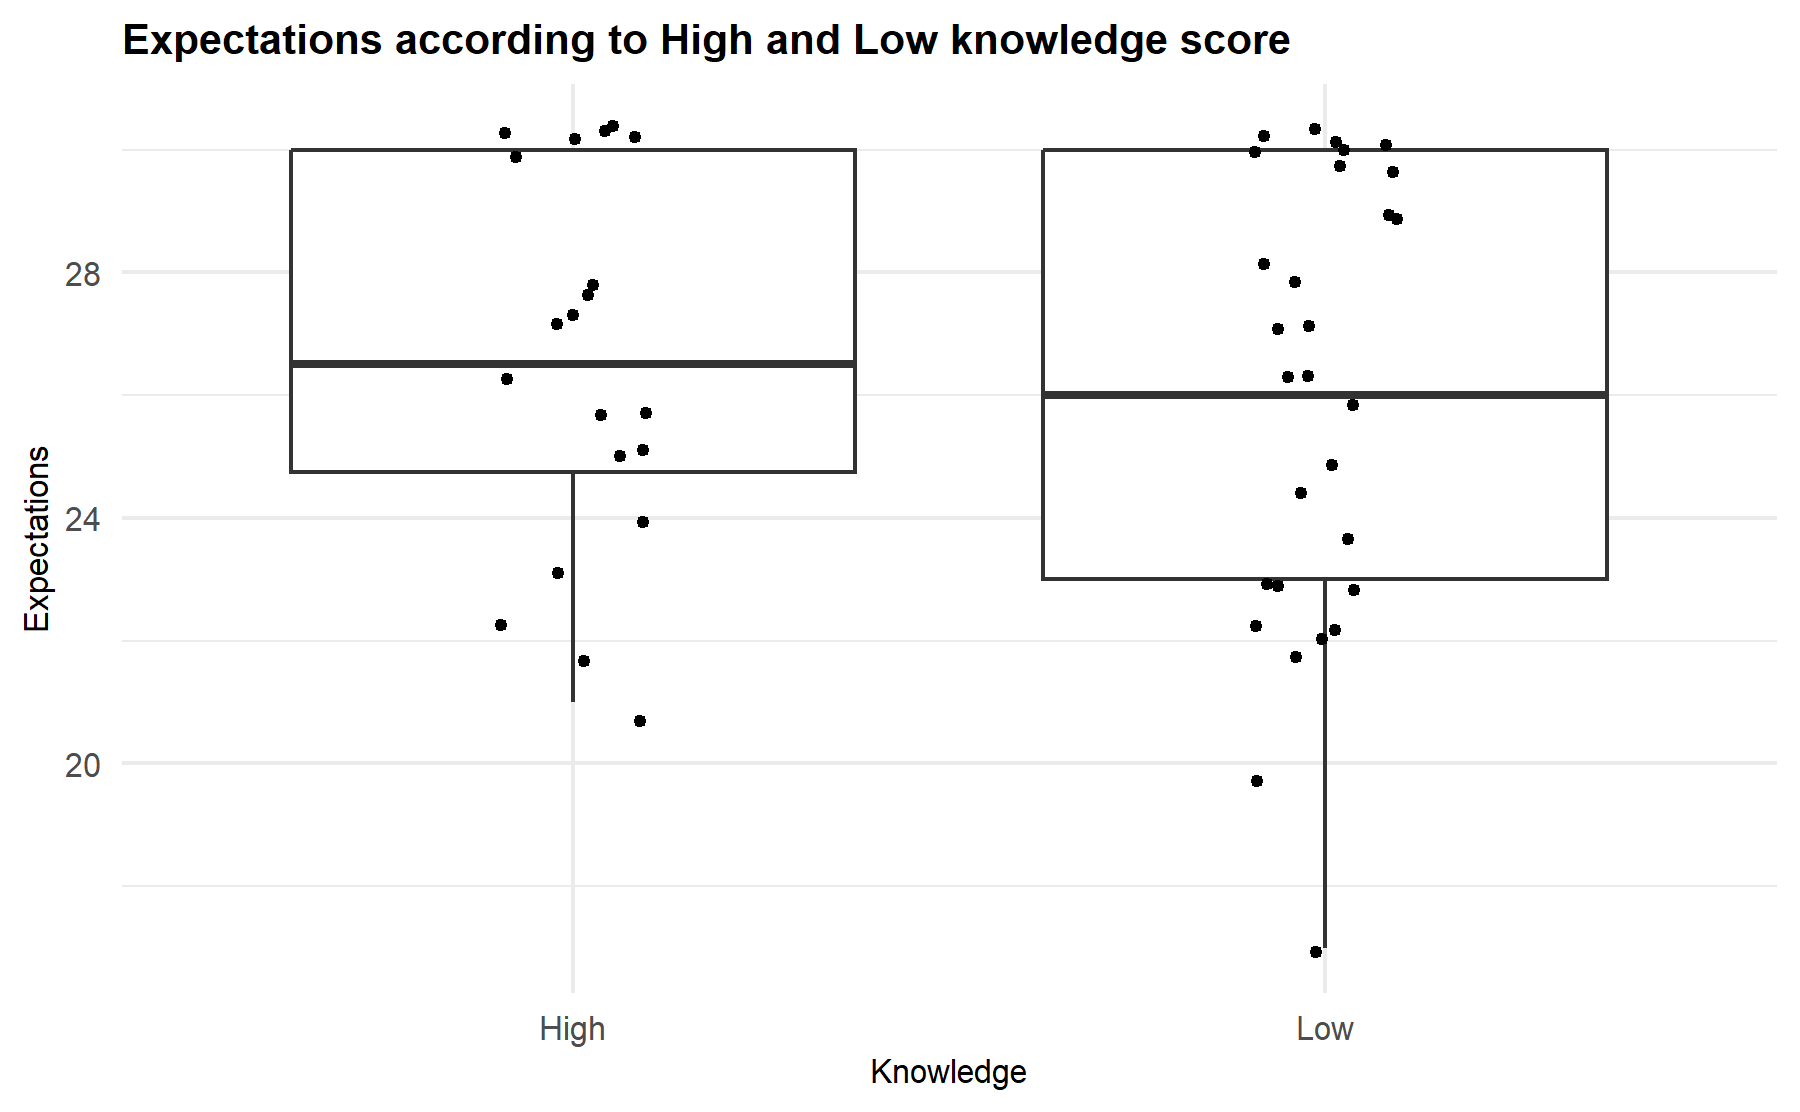
Then, knowledge is studied regarding concerns.
## Warning: Removed 1 rows containing missing values (`geom_point()`).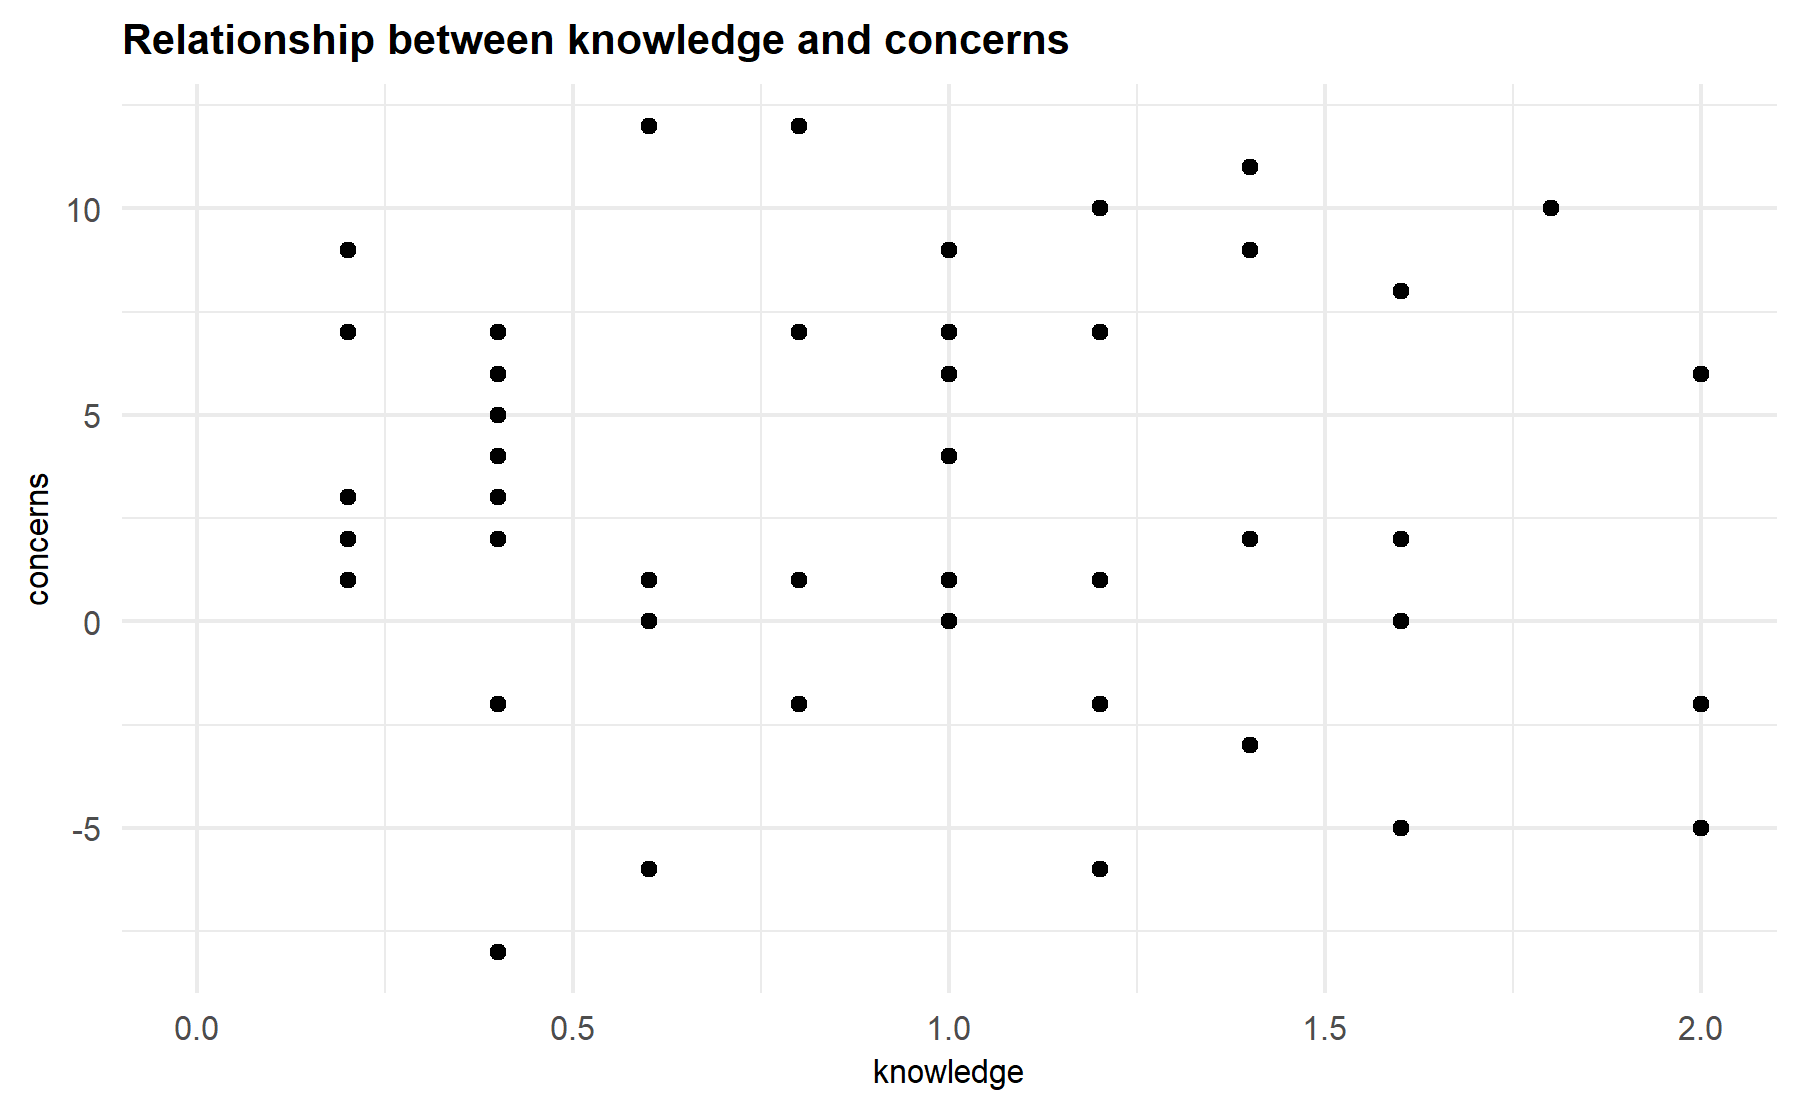 There is not a clear linear relationship between both variables. Then, in order to compare between two knowledge groups, a categorization is made. For this purpose, the knowledge score will be split into two levels considering the median score (median <= 1 or above).
## Warning: Removed 1 rows containing non-finite values (`stat_boxplot()`).## Warning: Removed 1 rows containing missing values (`geom_point()`).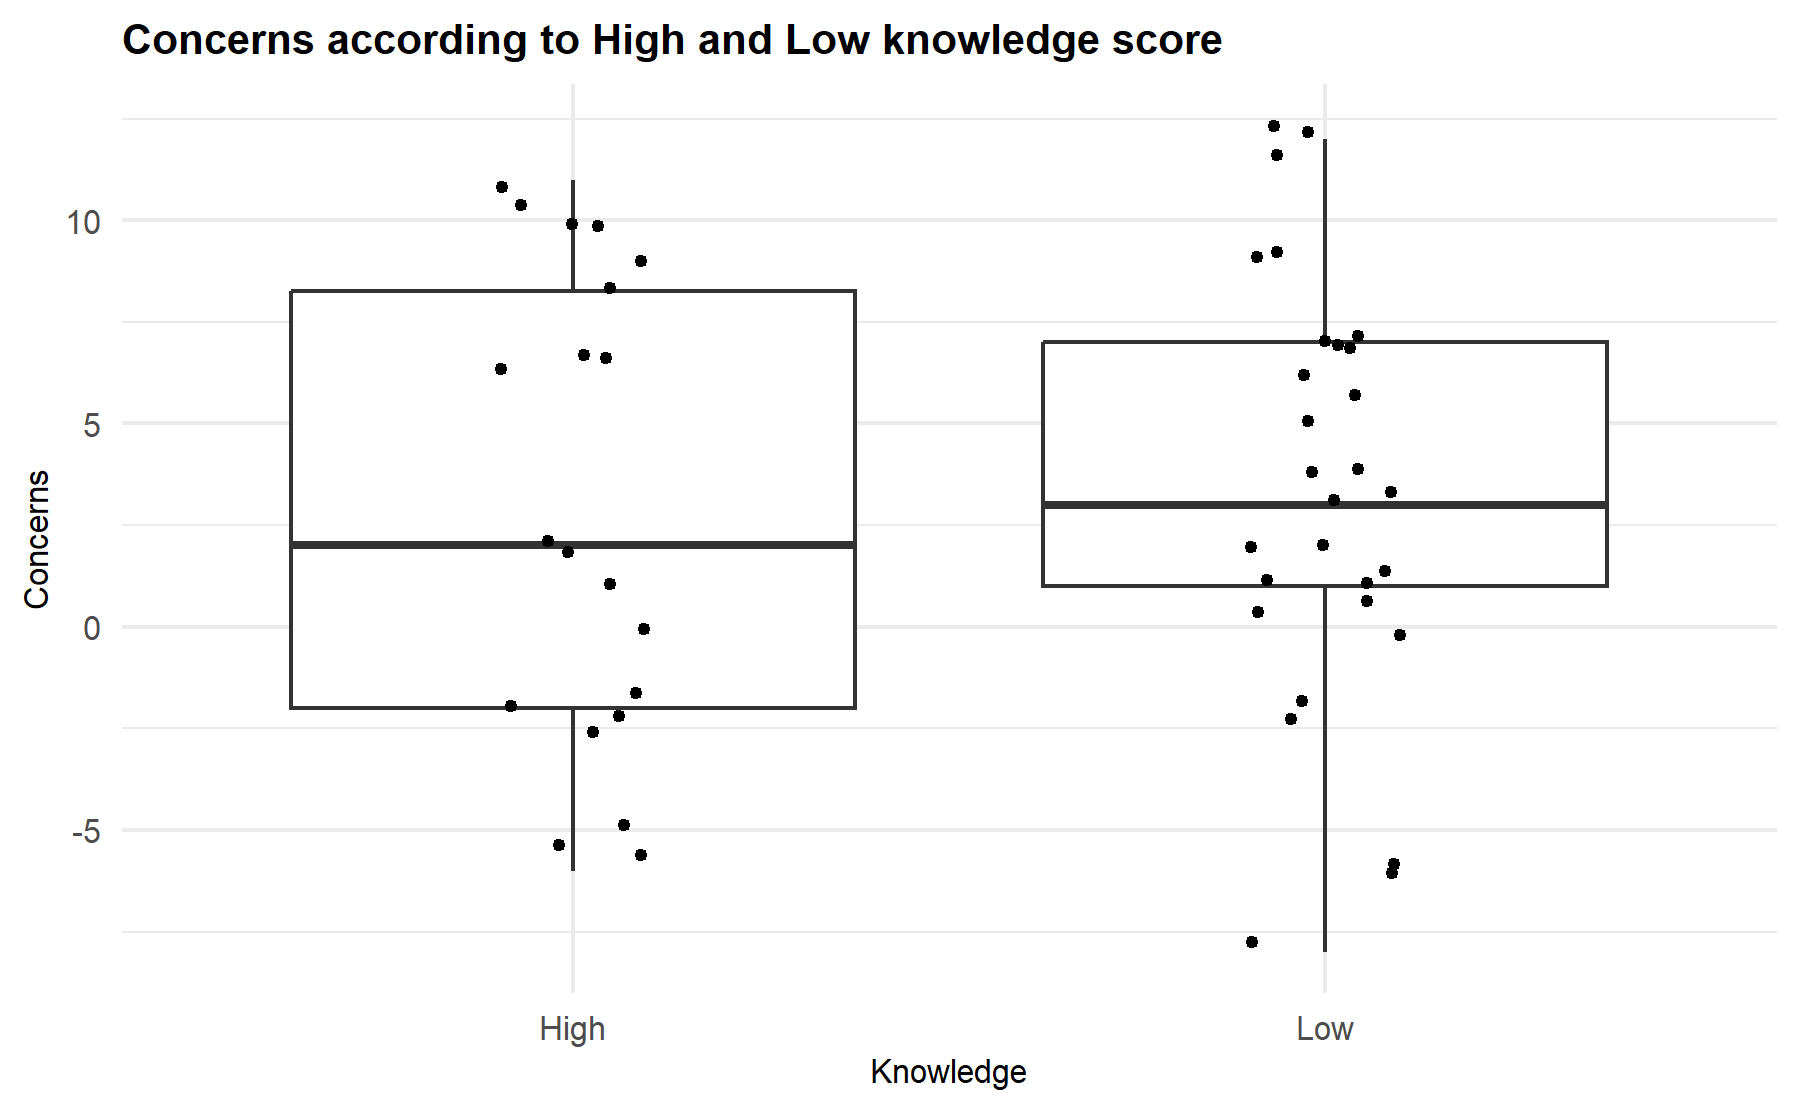
Finally, knowledge is analyzed with regard to attitudes.
## Warning: Removed 2 rows containing missing values (`geom_point()`).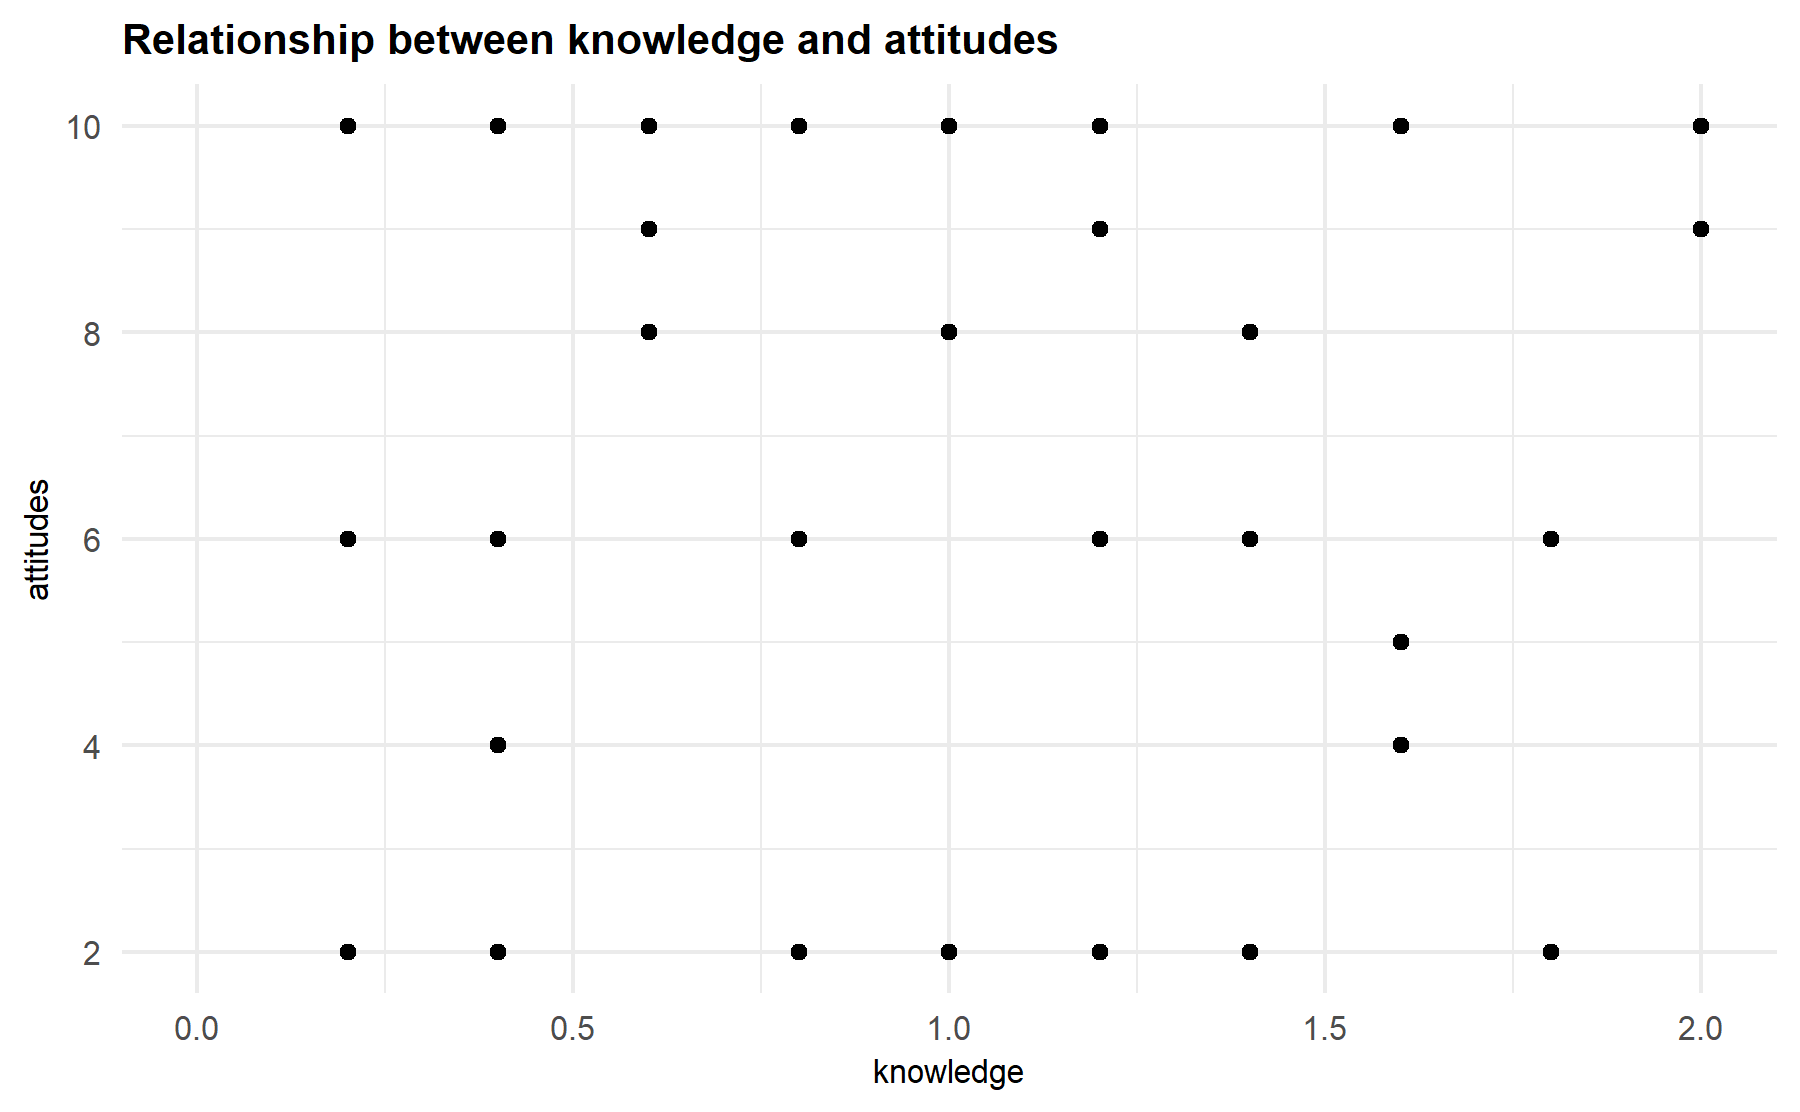 There is not a clear linear relationship between both variables. Then, in order to compare between two knowledge groups, a categorization is made. For this purpose, the knowledge score will be split into two levels considering the median score (median <= 1 or above).
## Warning: Removed 2 rows containing non-finite values (`stat_boxplot()`).## Warning: Removed 2 rows containing missing values (`geom_point()`).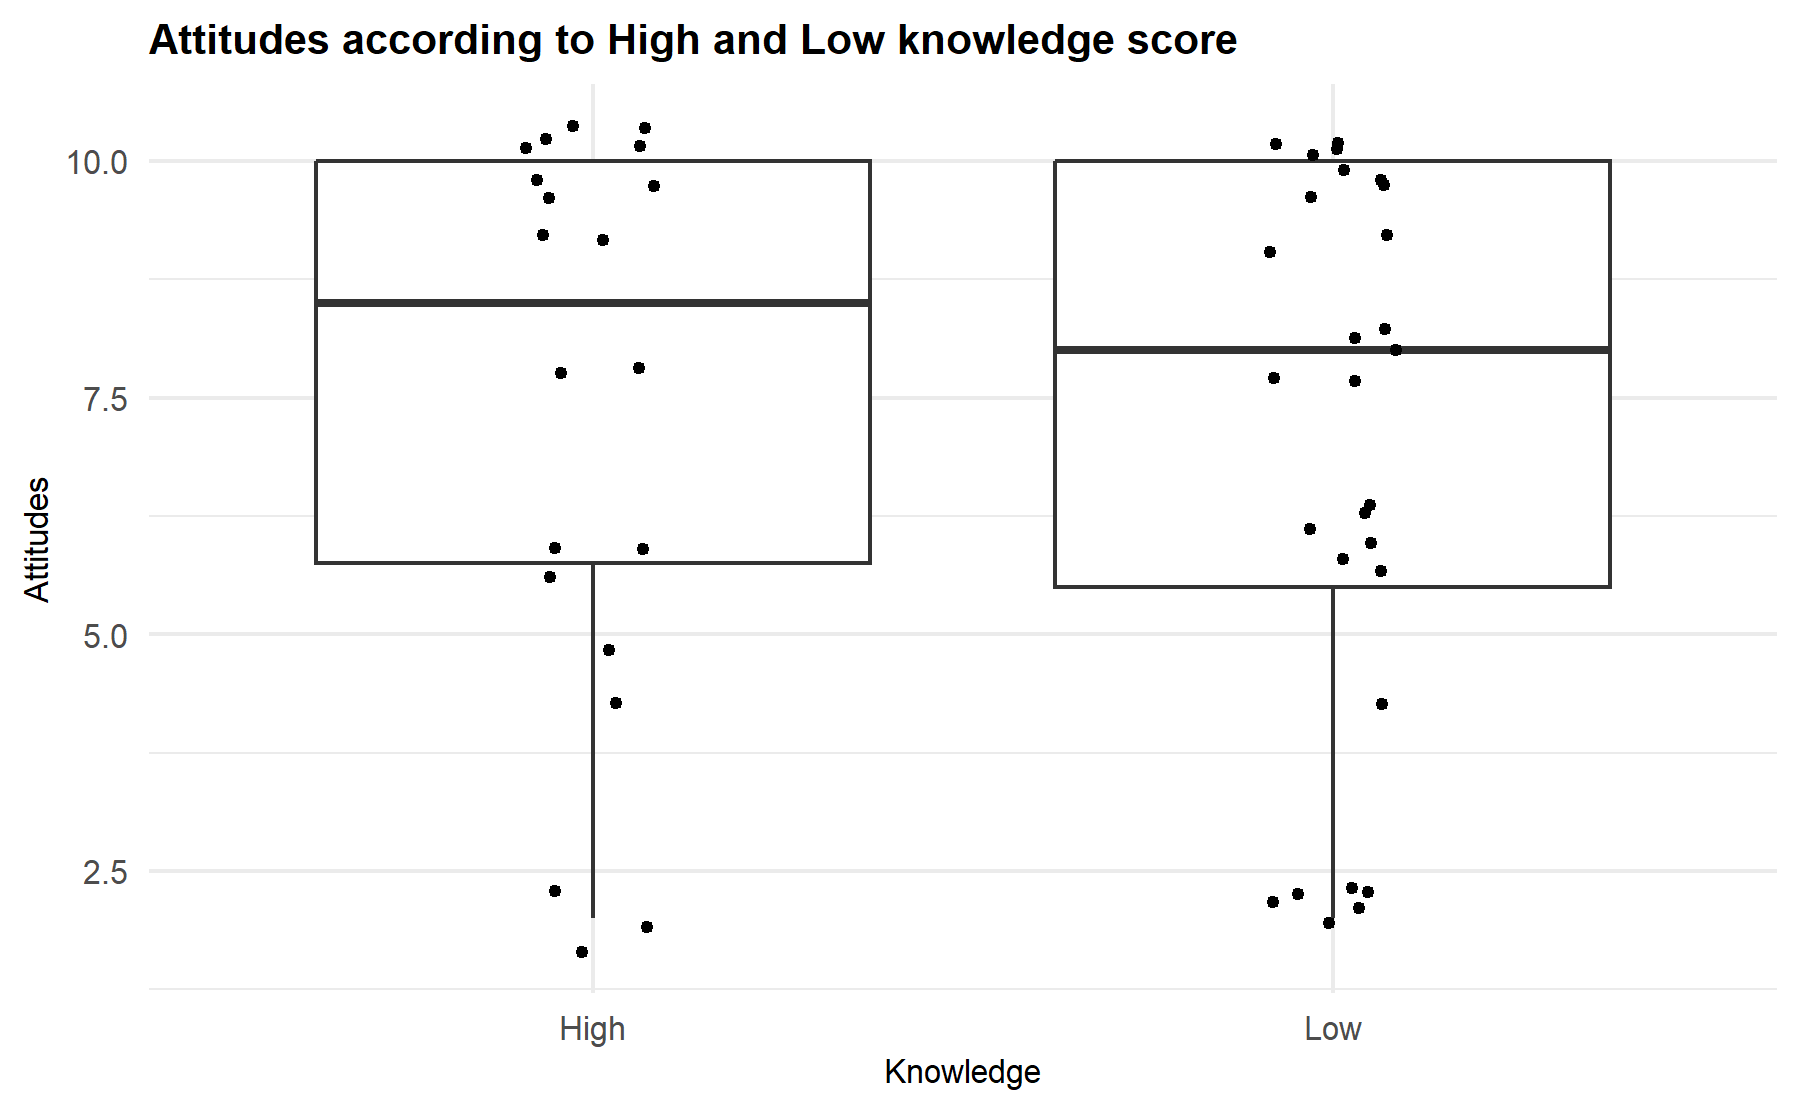
14.3 Relatioship between domains and sociodemographics
14.3.1 Description of sociodemographics
There are two main features in the sociodemographic sphere:
The previously built variable: education_high.
Region of residence.
| Region | Frequency |
|---|---|
| City | 41 |
| Town | 9 |
| High Education | Frequency |
|---|---|
| No | 25 |
| Yes | 22 |
| Unknown | 3 |
14.3.2 Association between sociodemographics score and each domain
The relationship between sociodemographics and expectations is analyzed.
## Warning: Removed 1 rows containing non-finite values (`stat_boxplot()`).## Warning: Removed 1 rows containing missing values (`geom_point()`).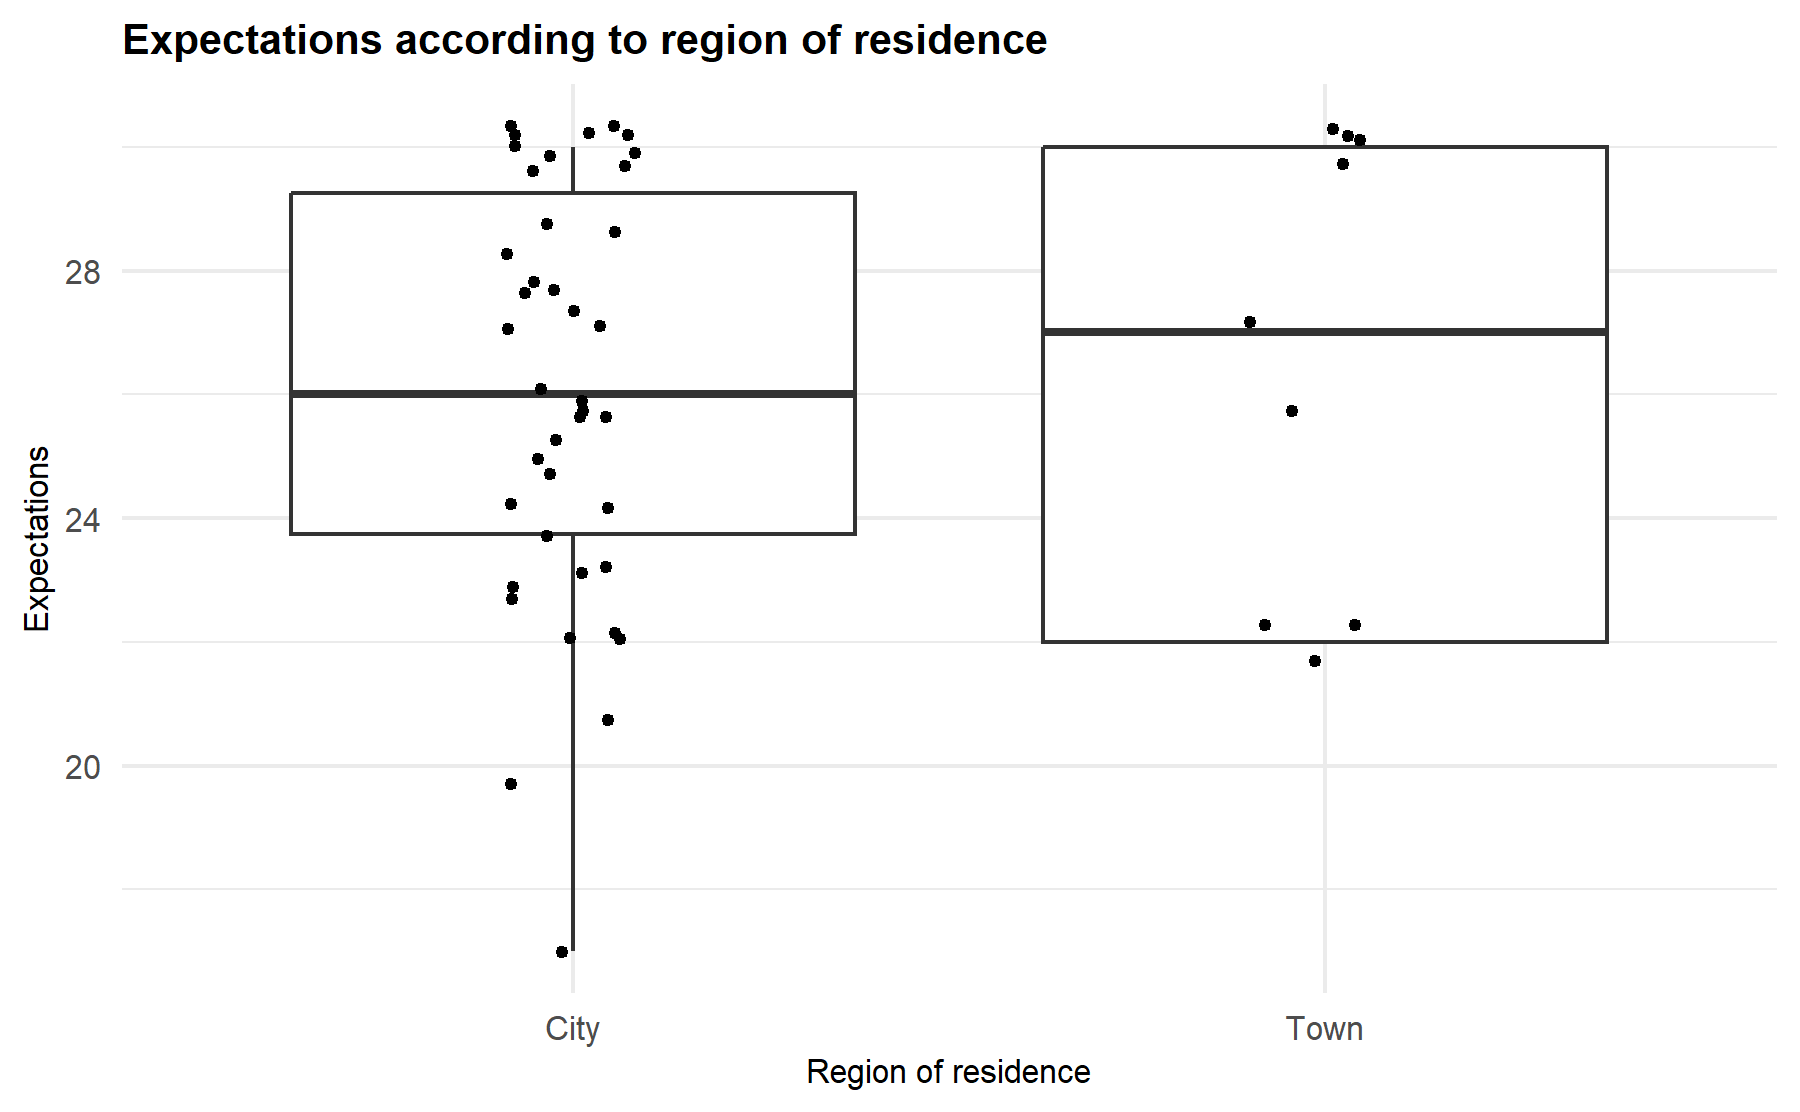
## Warning: Removed 1 rows containing non-finite values (`stat_boxplot()`).
## Removed 1 rows containing missing values (`geom_point()`).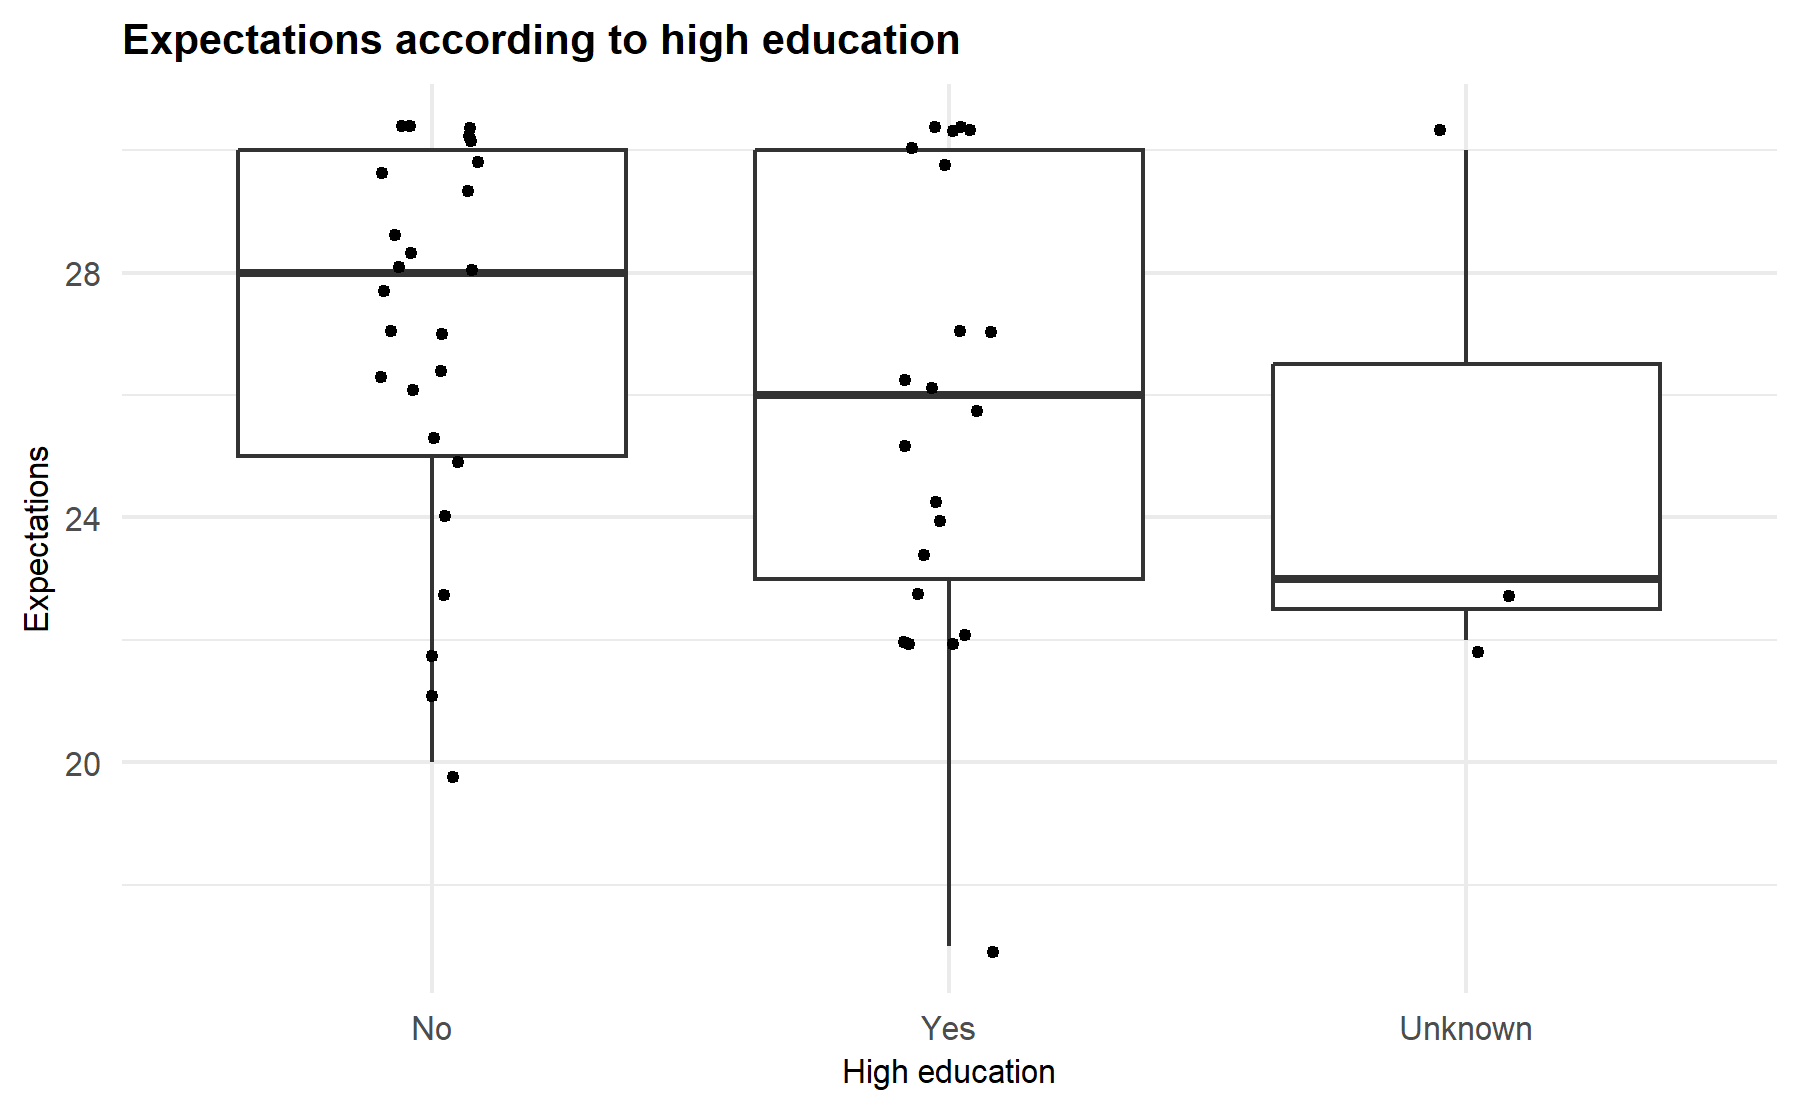
A comparison is made between high and low education level regarding expectations. The Median test does not show statistically significant difference (p-value= 0.1389).
The relationship between sociodemographics and concerns is analyzed.
## Warning: Removed 1 rows containing non-finite values (`stat_boxplot()`).## Warning: Removed 1 rows containing missing values (`geom_point()`).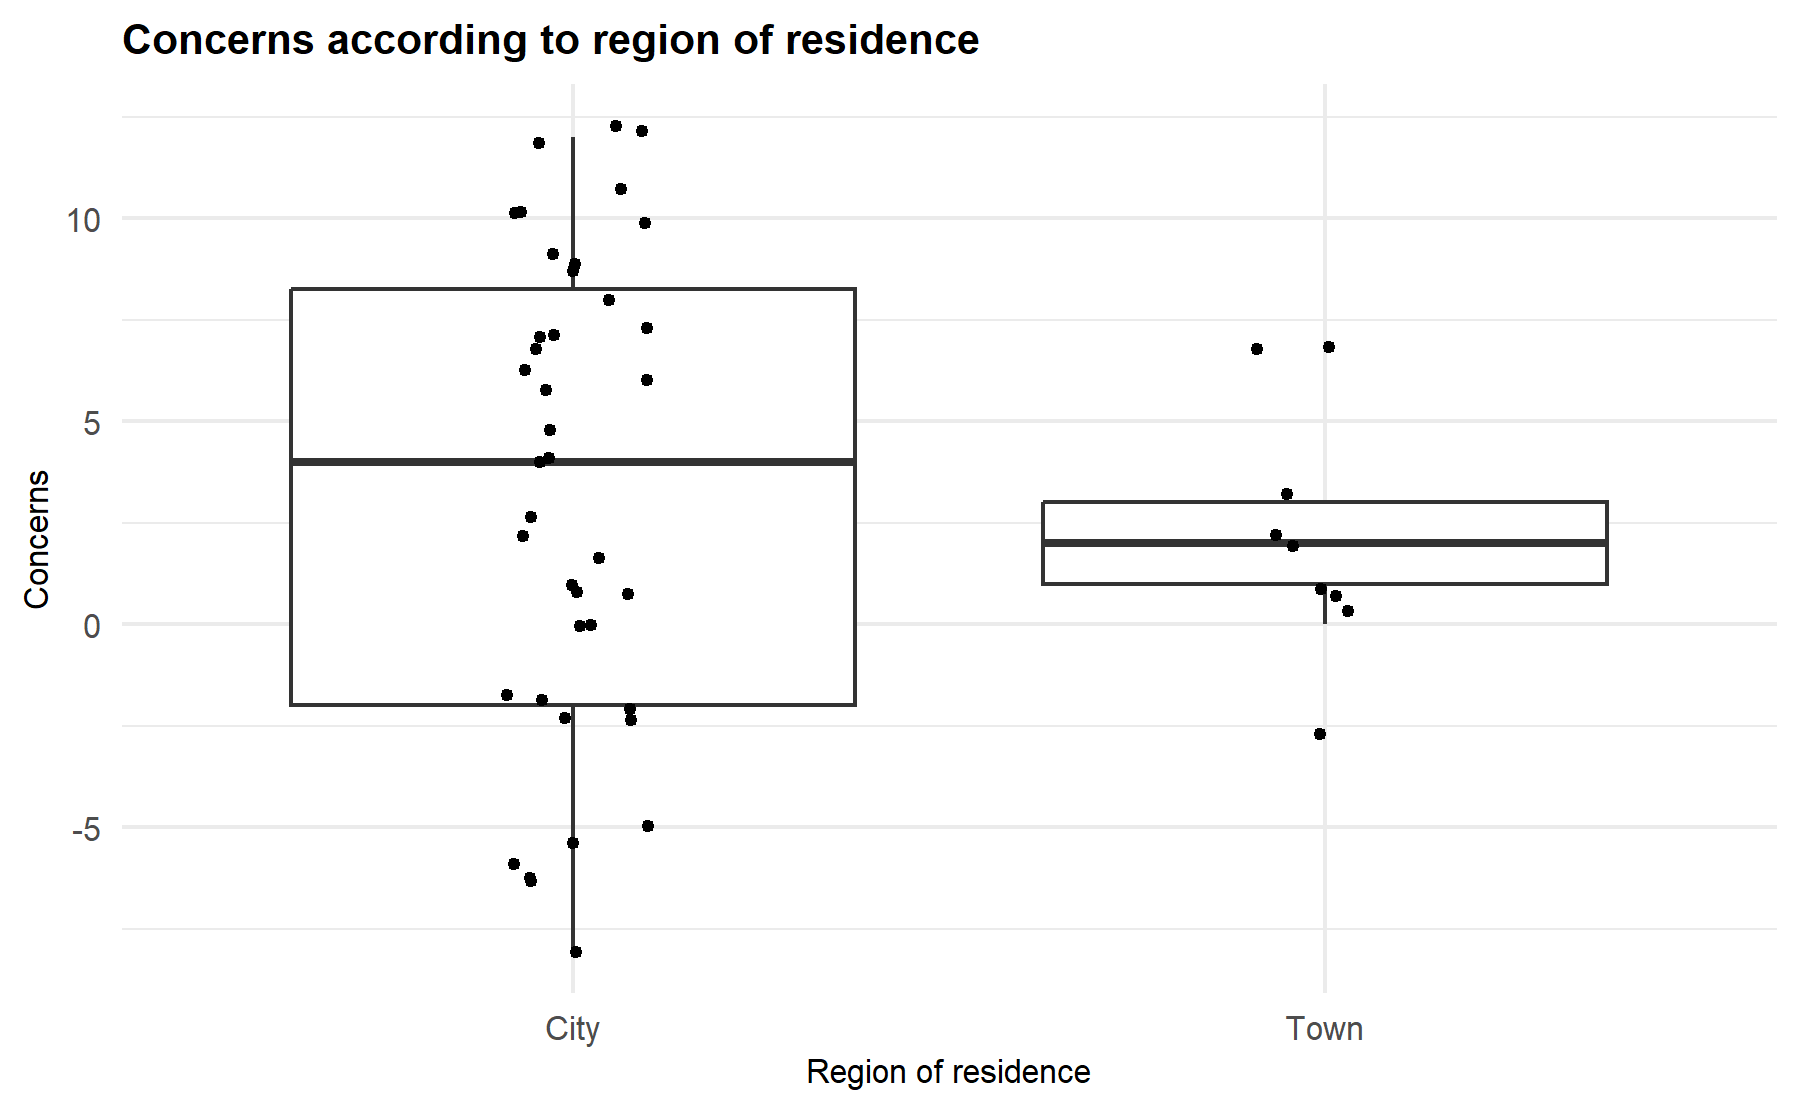
## Warning: Removed 1 rows containing non-finite values (`stat_boxplot()`).
## Removed 1 rows containing missing values (`geom_point()`).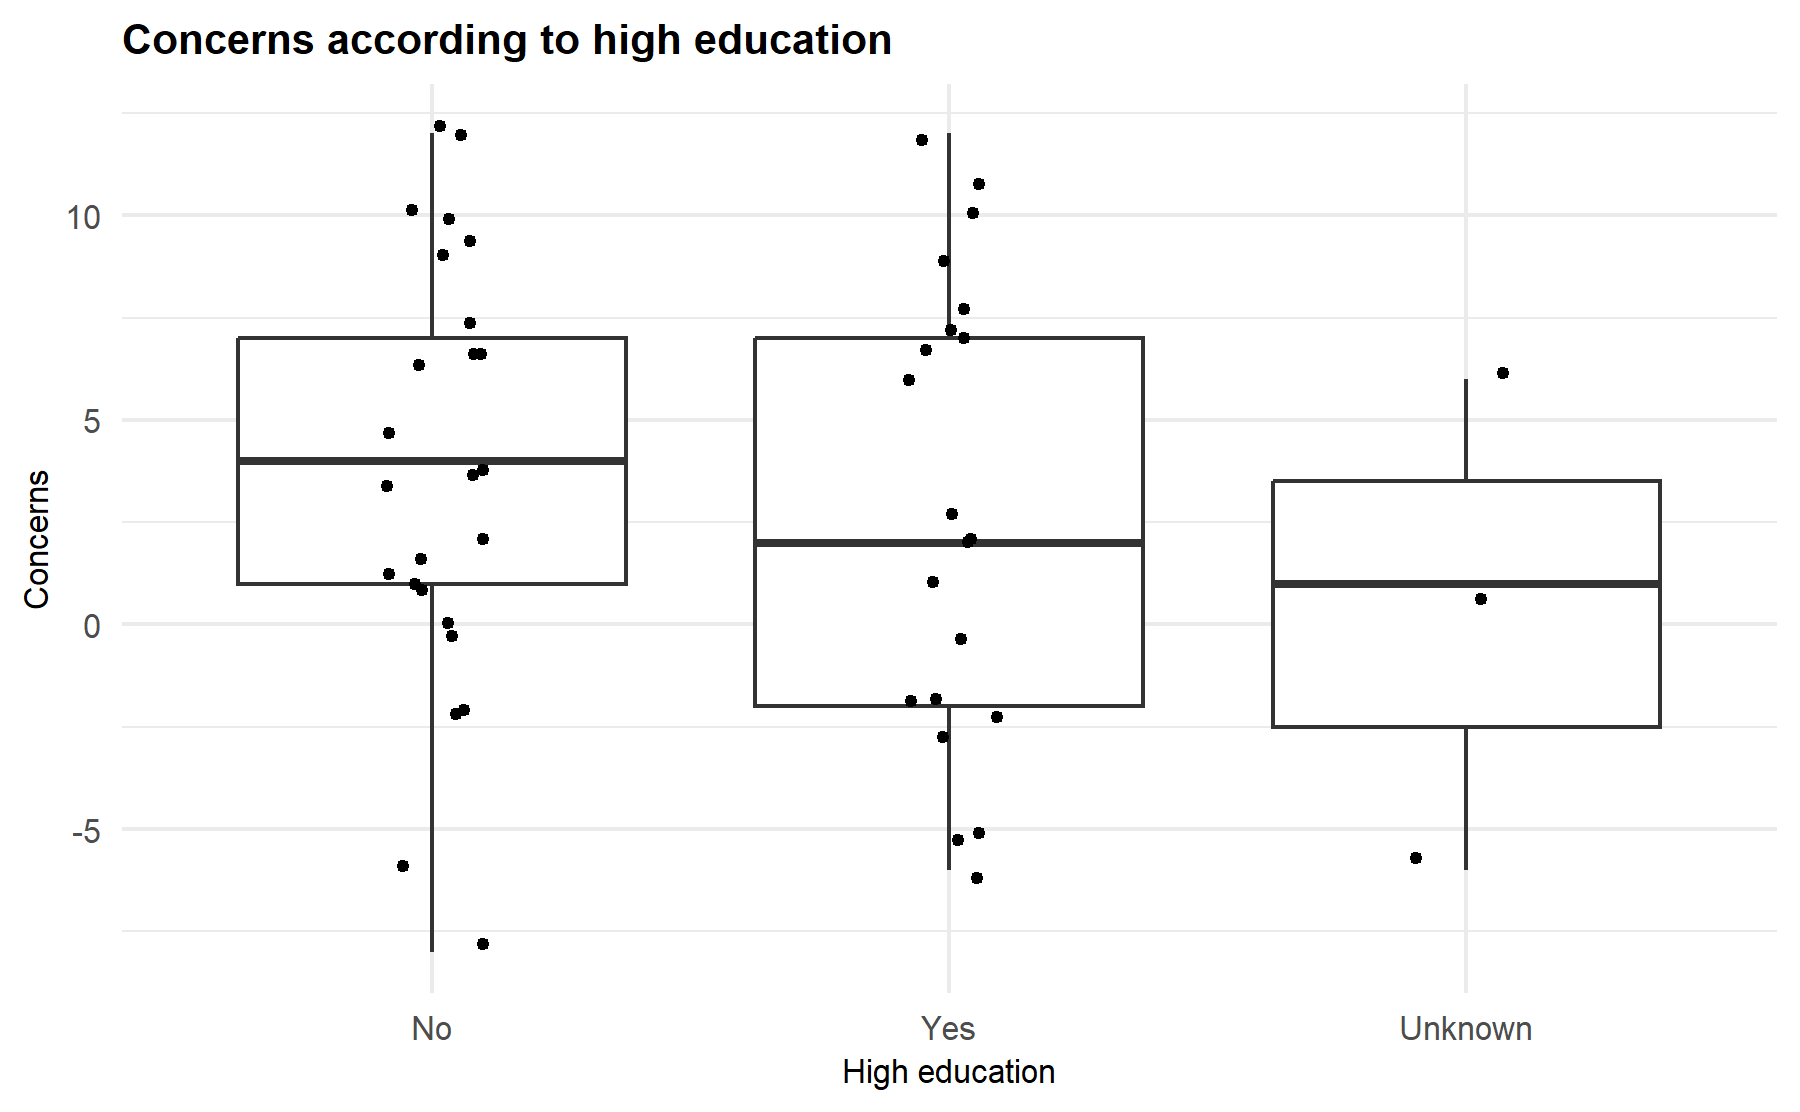
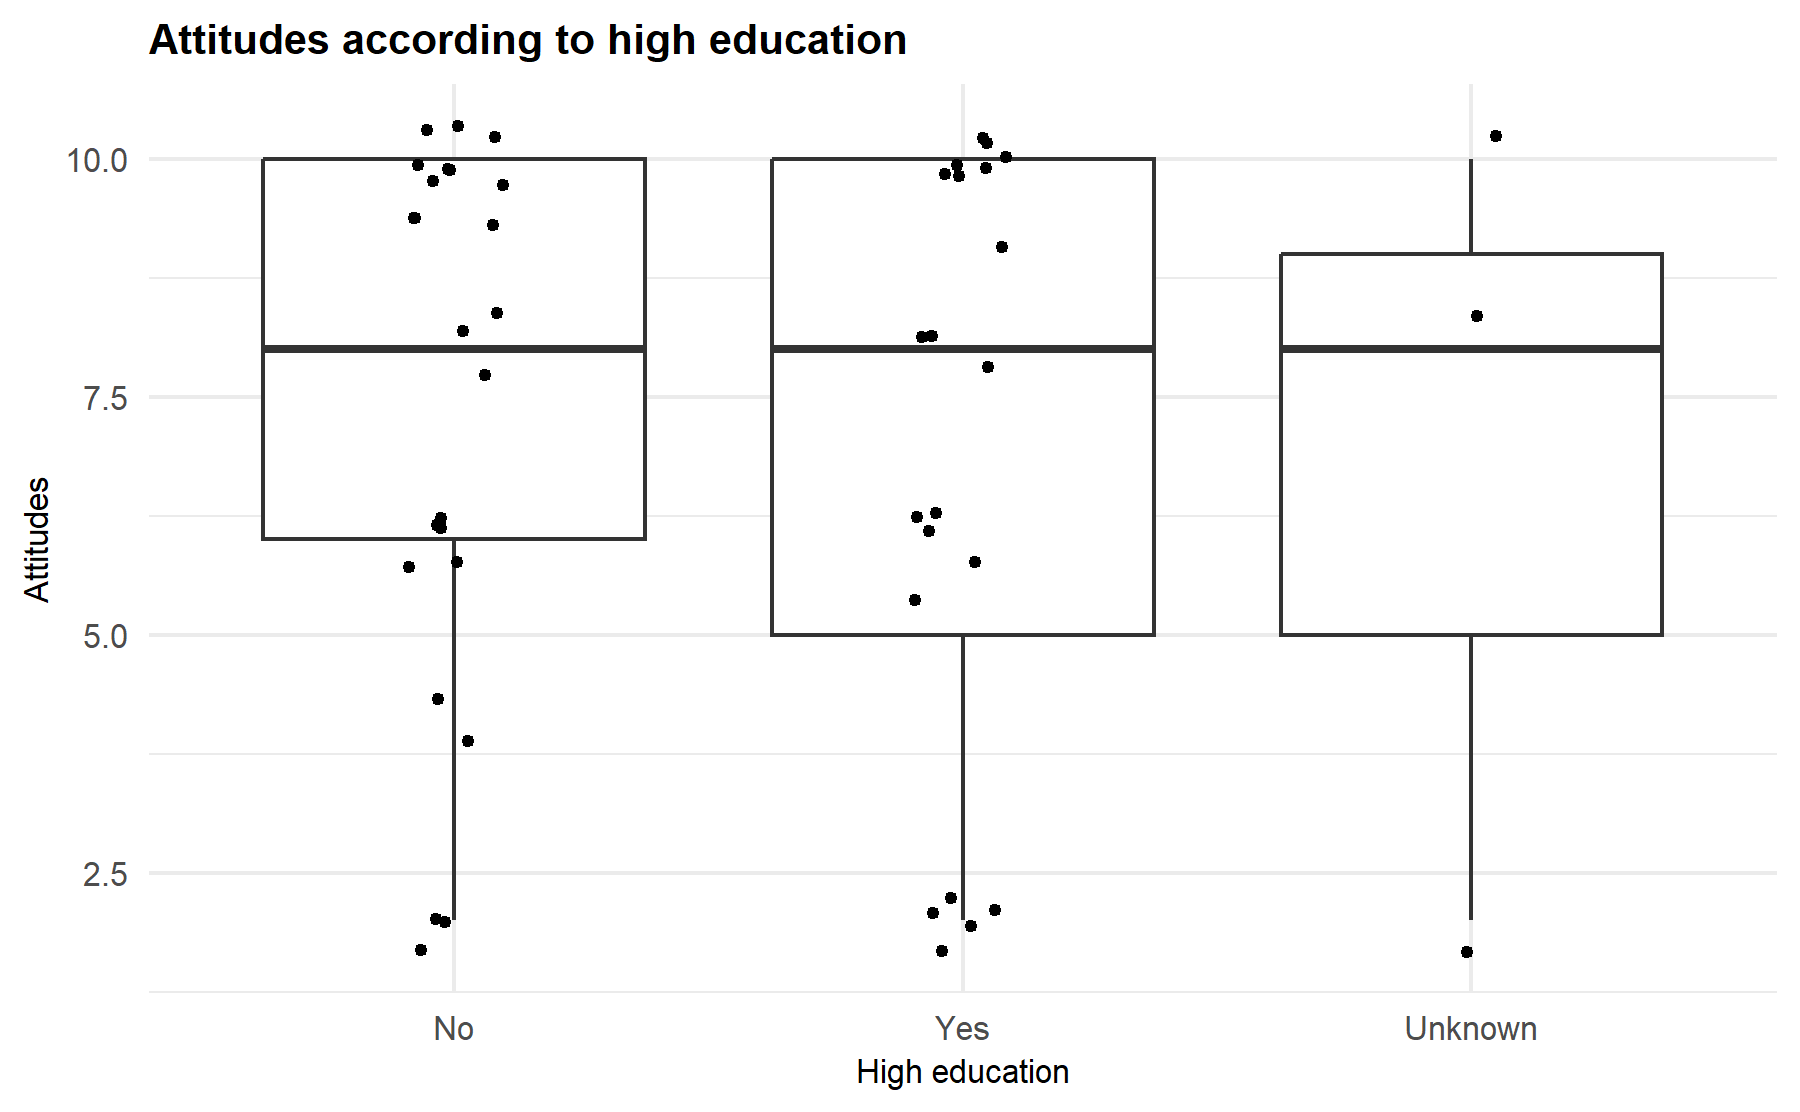
The relationship between sociodemographics and attitudes is analyzed.
## Warning: Removed 2 rows containing non-finite values (`stat_boxplot()`).## Warning: Removed 2 rows containing missing values (`geom_point()`).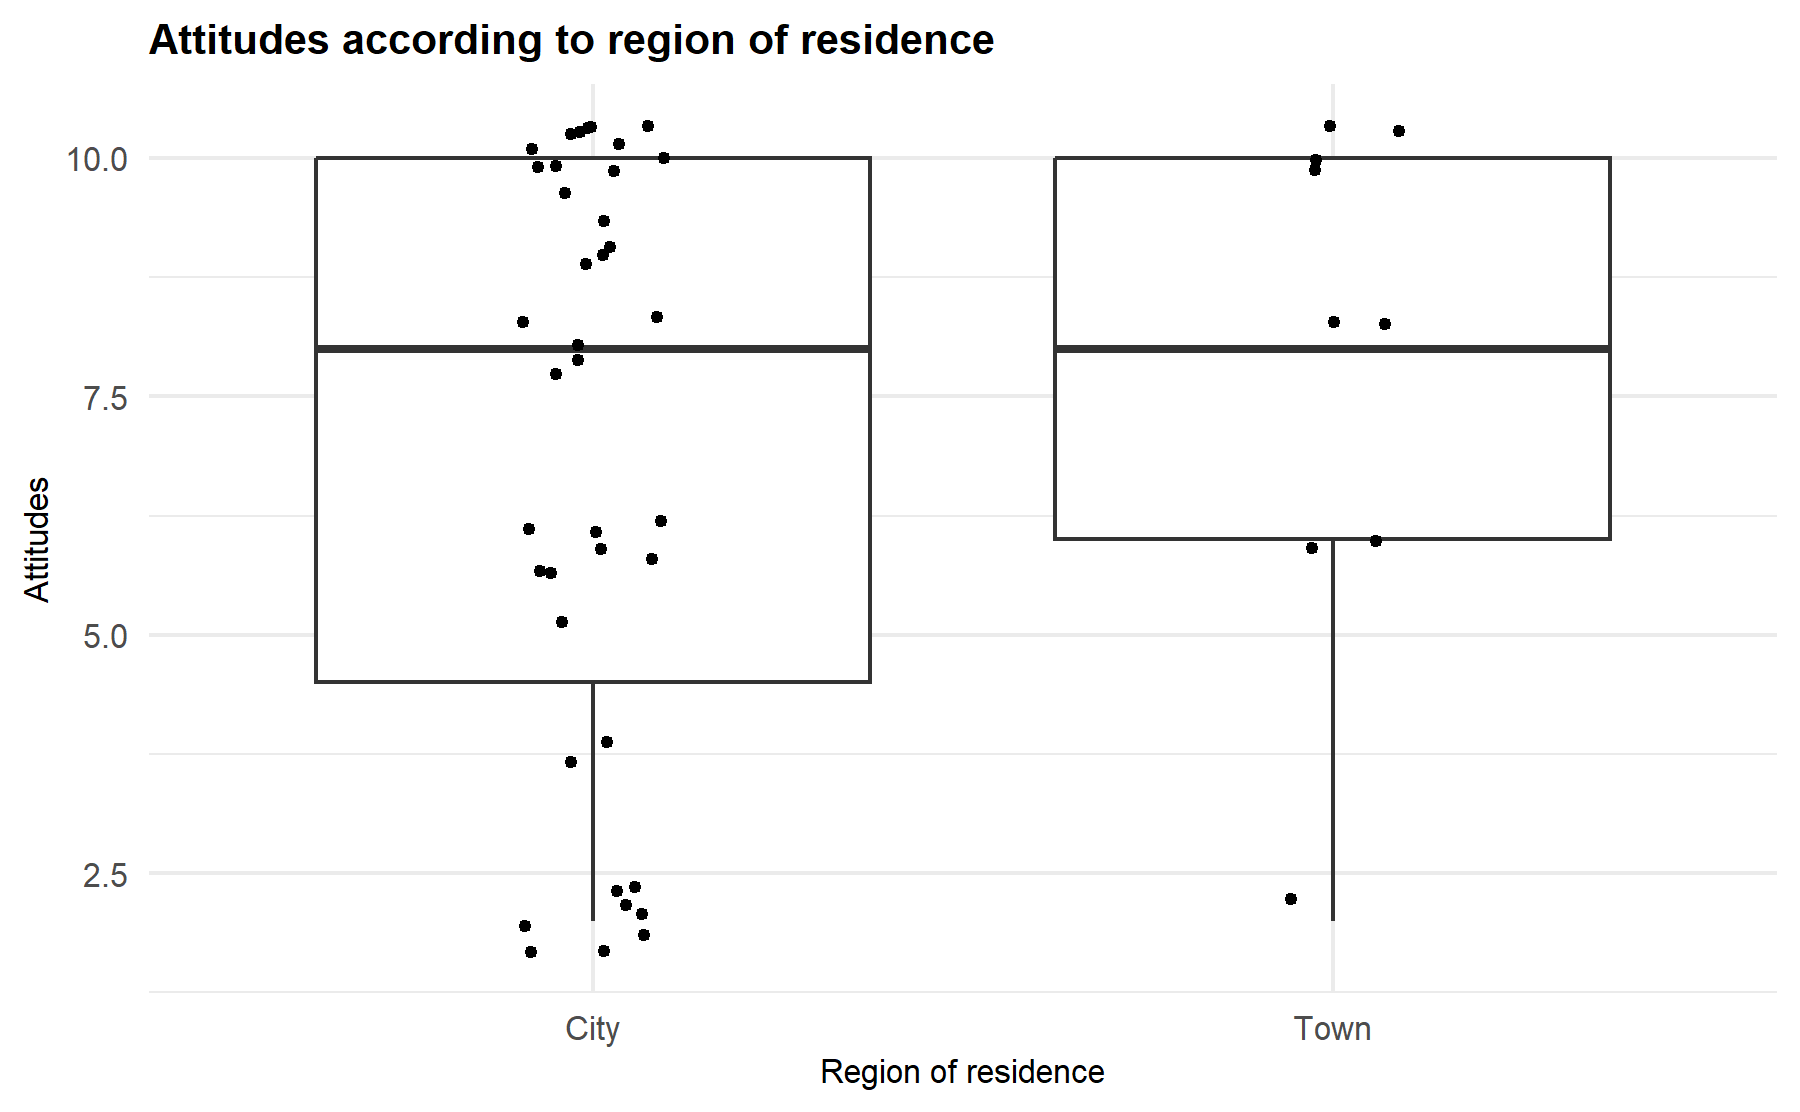
## Warning: Removed 2 rows containing non-finite values (`stat_boxplot()`).
## Removed 2 rows containing missing values (`geom_point()`).