Chapter 11 Post-test Questionnaire- Descriptive and exploratory analysis
11.1 Experience and participation domain
The first part of the post-test questionnaire is about how the patient considers that was his participation in the study and if he think that the genomic testing was a positive experience.
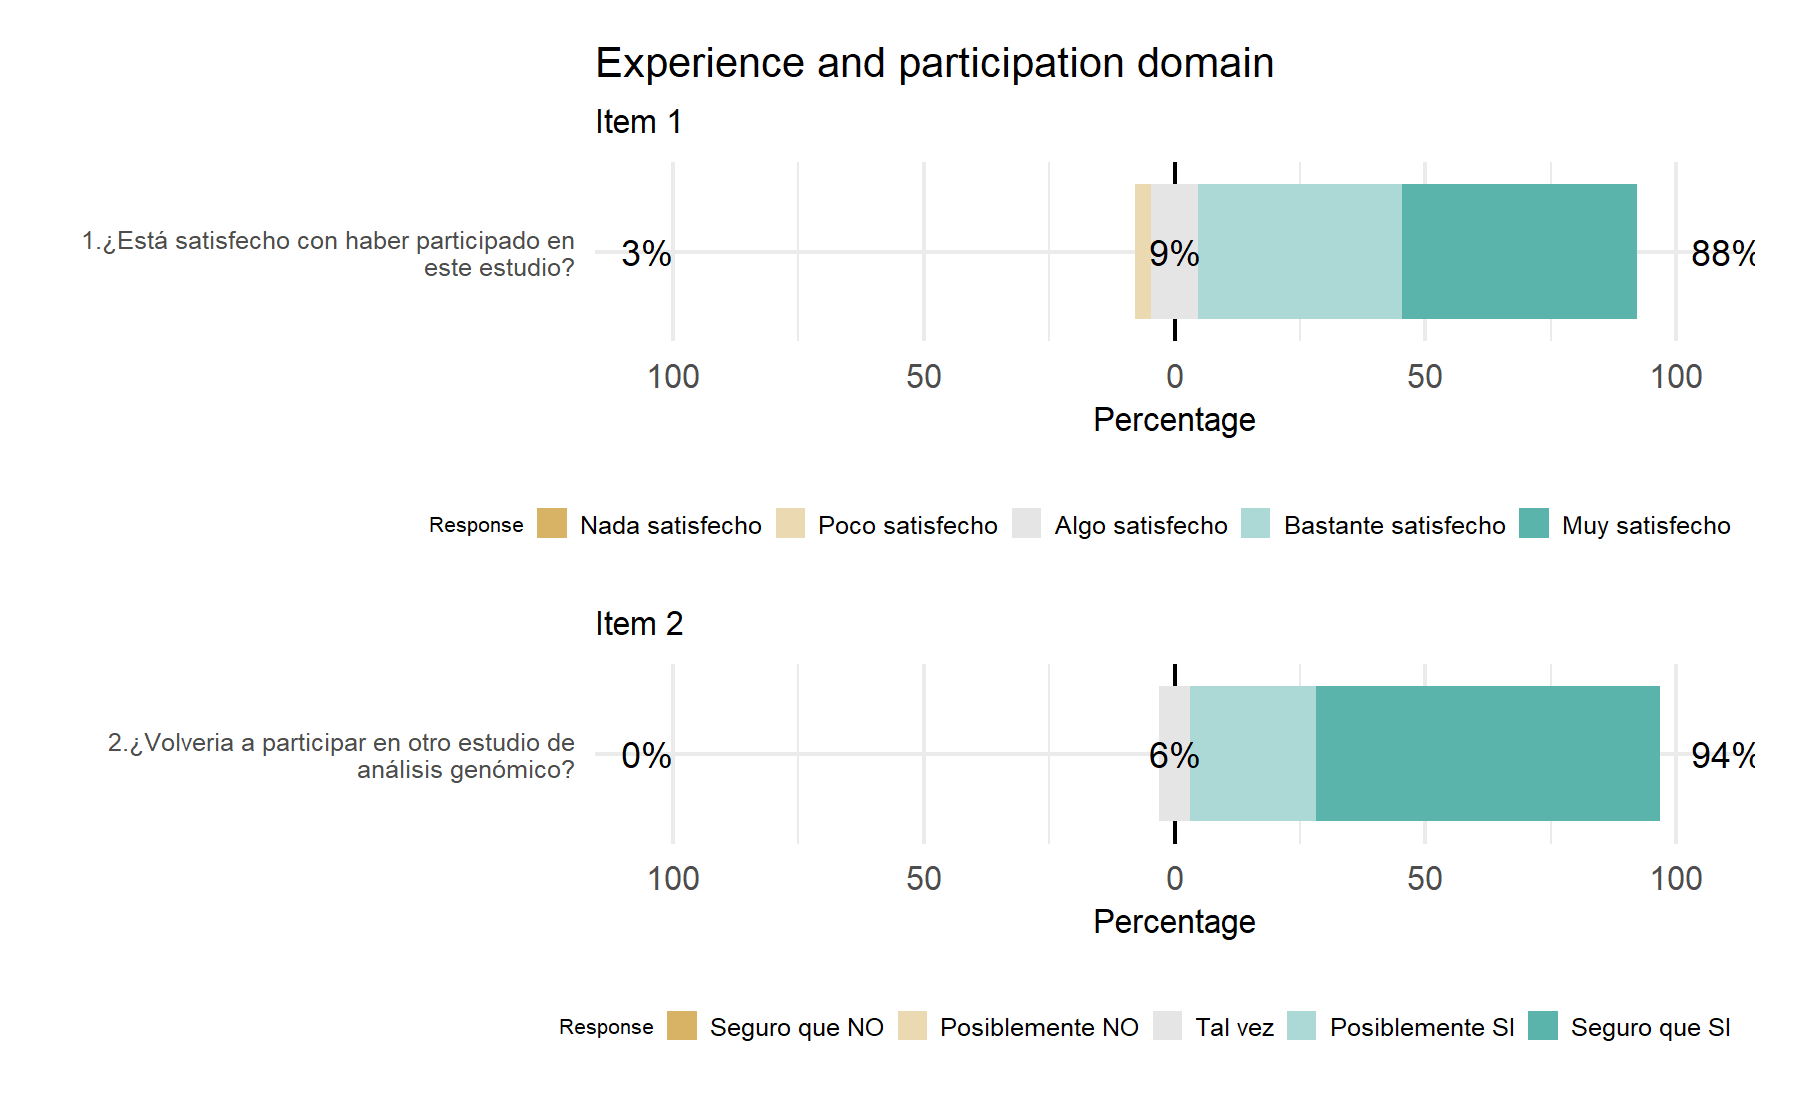
These two questions do not show a high variability with regards to the answers but both are important to have an overview of how patients perceive the study and genomic testing. A similar pattern was seen in the VHIO cohort. Therefore, they will be maintained.
11.2 Expectations and concerns domain
In the post-test questionnaire, the same items for expectations were included. Regarding concerns, the idea of the four questions was conserved but in this setting, the focus is not on the concern itself but if that worry or fear has become a reality. Again, there are 11 questions, but one (the seventh) has 5 items. Thus, there are a total of 15 items in this domain, 11 for expectations (from 1 to 7.v.) and 4 for concerns (8 to 11). All of them with the same likert scale.
11.2.1 Visualizing items and responses
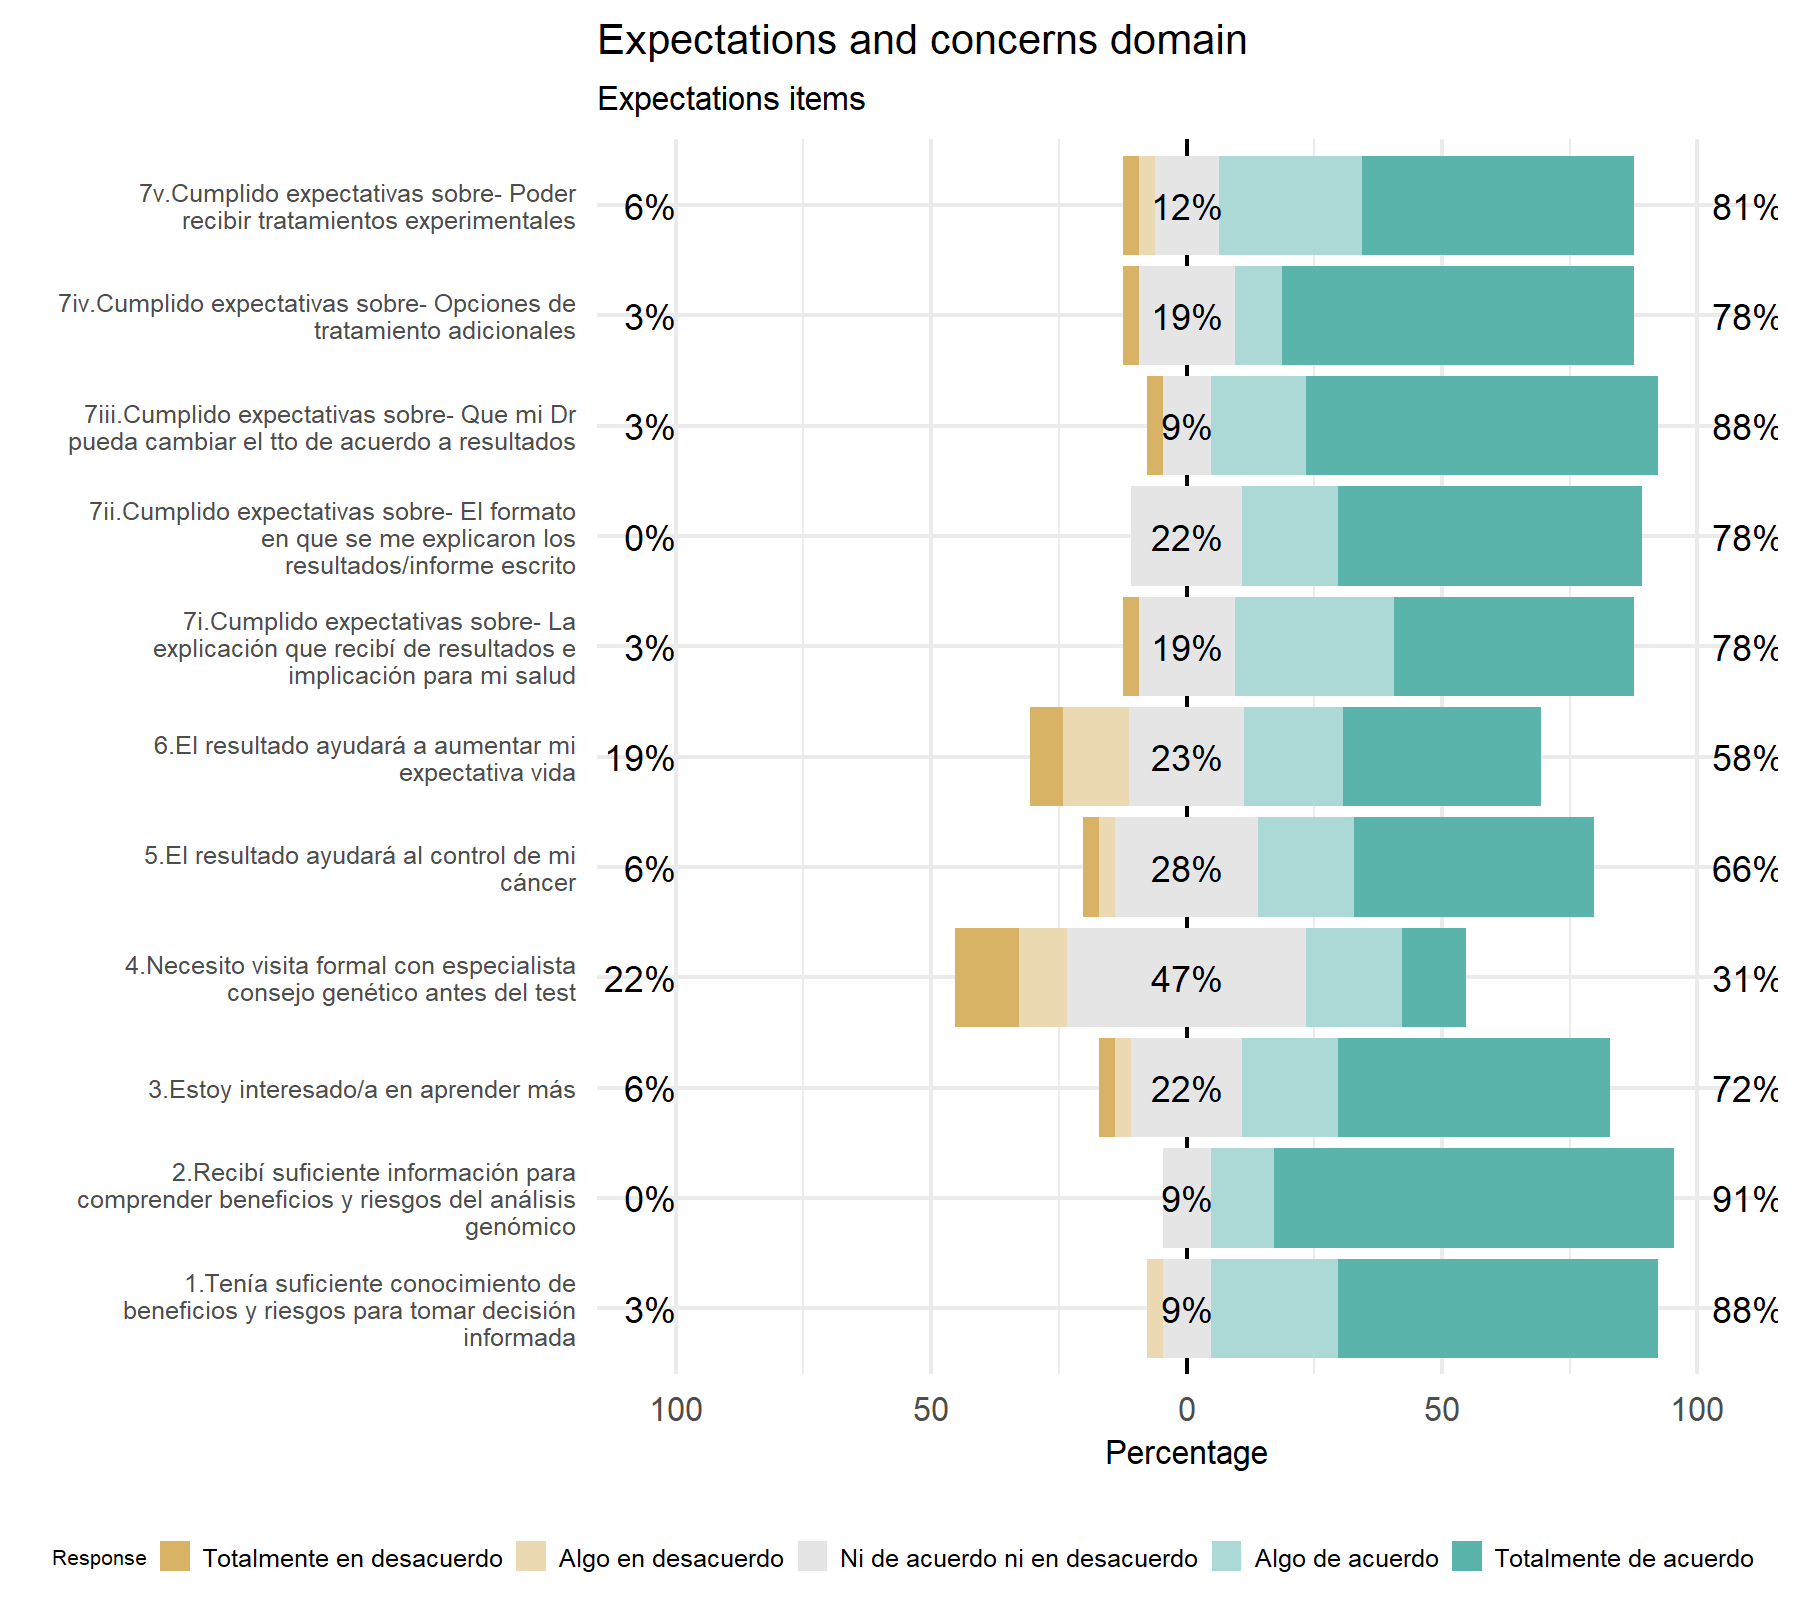
From the first visual analysis, all items except the number 4 have a wide majority of agreement answers, with a higher percentage of totally agree answers. However, Q6 has also a considerable proportion of disagreement (19%). Then, items with less variability are 7.ii and 2, followed by 7.iii and 1. The item 4, with an inverted design, have a 31% of agreement and a 22% of disagreement. Those with more variability are 6, 5, 3, 7.v, followed by 7.i and 7.iii in decreasing order. These results share some similarities with those from the VHIO cohort.
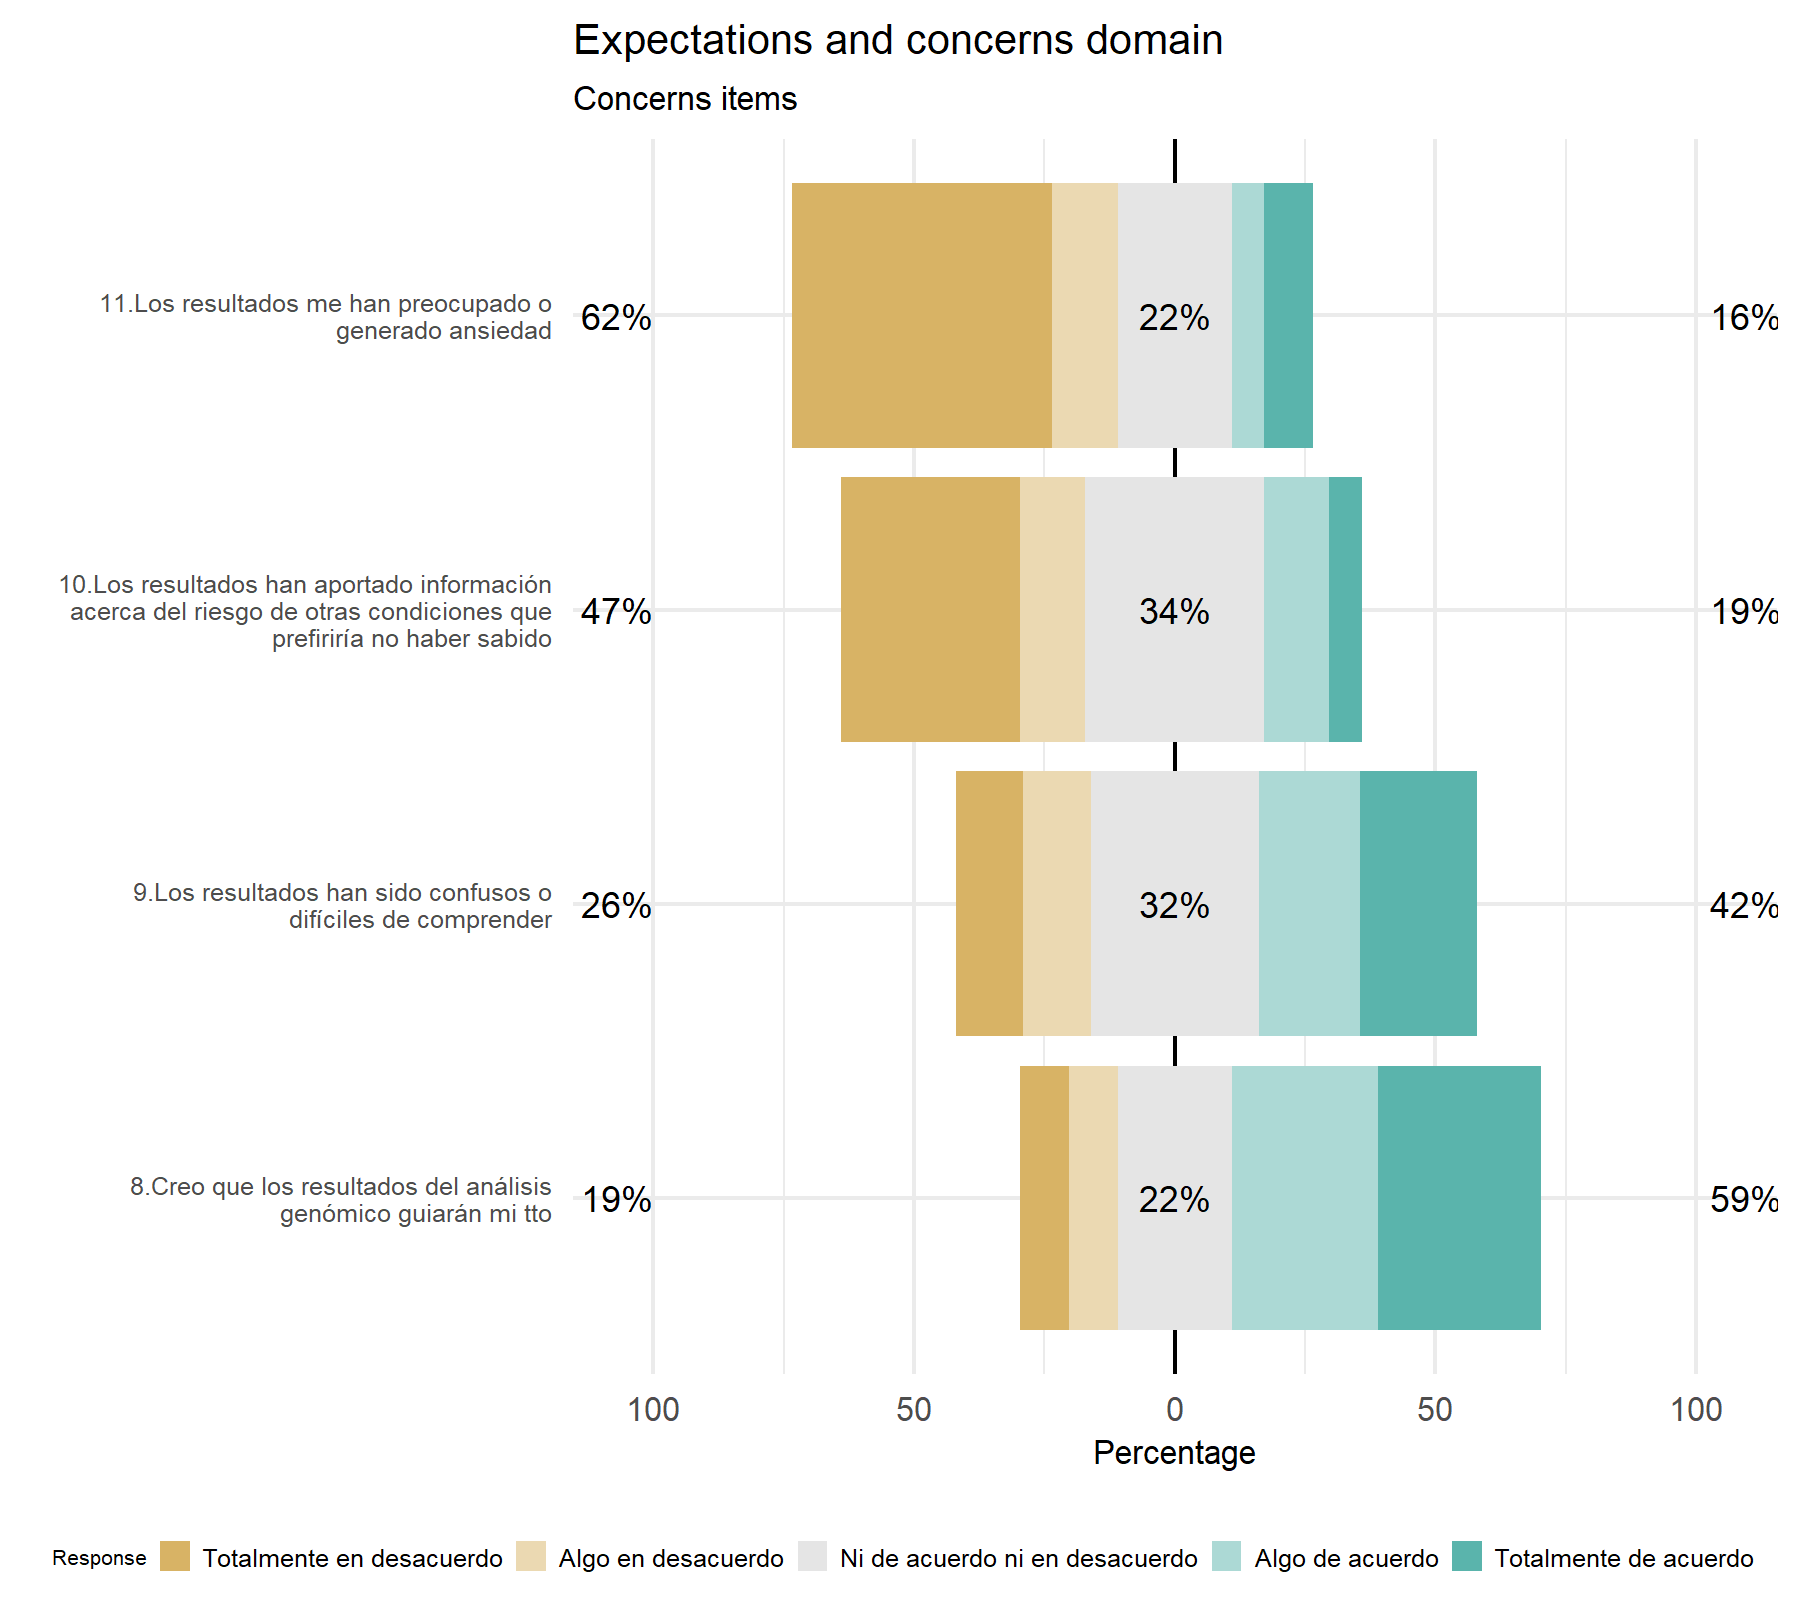
With regards to concerns, there are variability in the four answers. The number 8 could have the lower variability with the higher percentage of agreement answers. Results with high similarity with VHIO cohort.
As second exploratory approach analysis, the difficulty and discrimination capacity is evaluate for each of these items.
## Scale for fill is already present.
## Adding another scale for fill, which will replace the existing scale.
## Scale for colour is already present.
## Adding another scale for colour, which will replace the existing scale.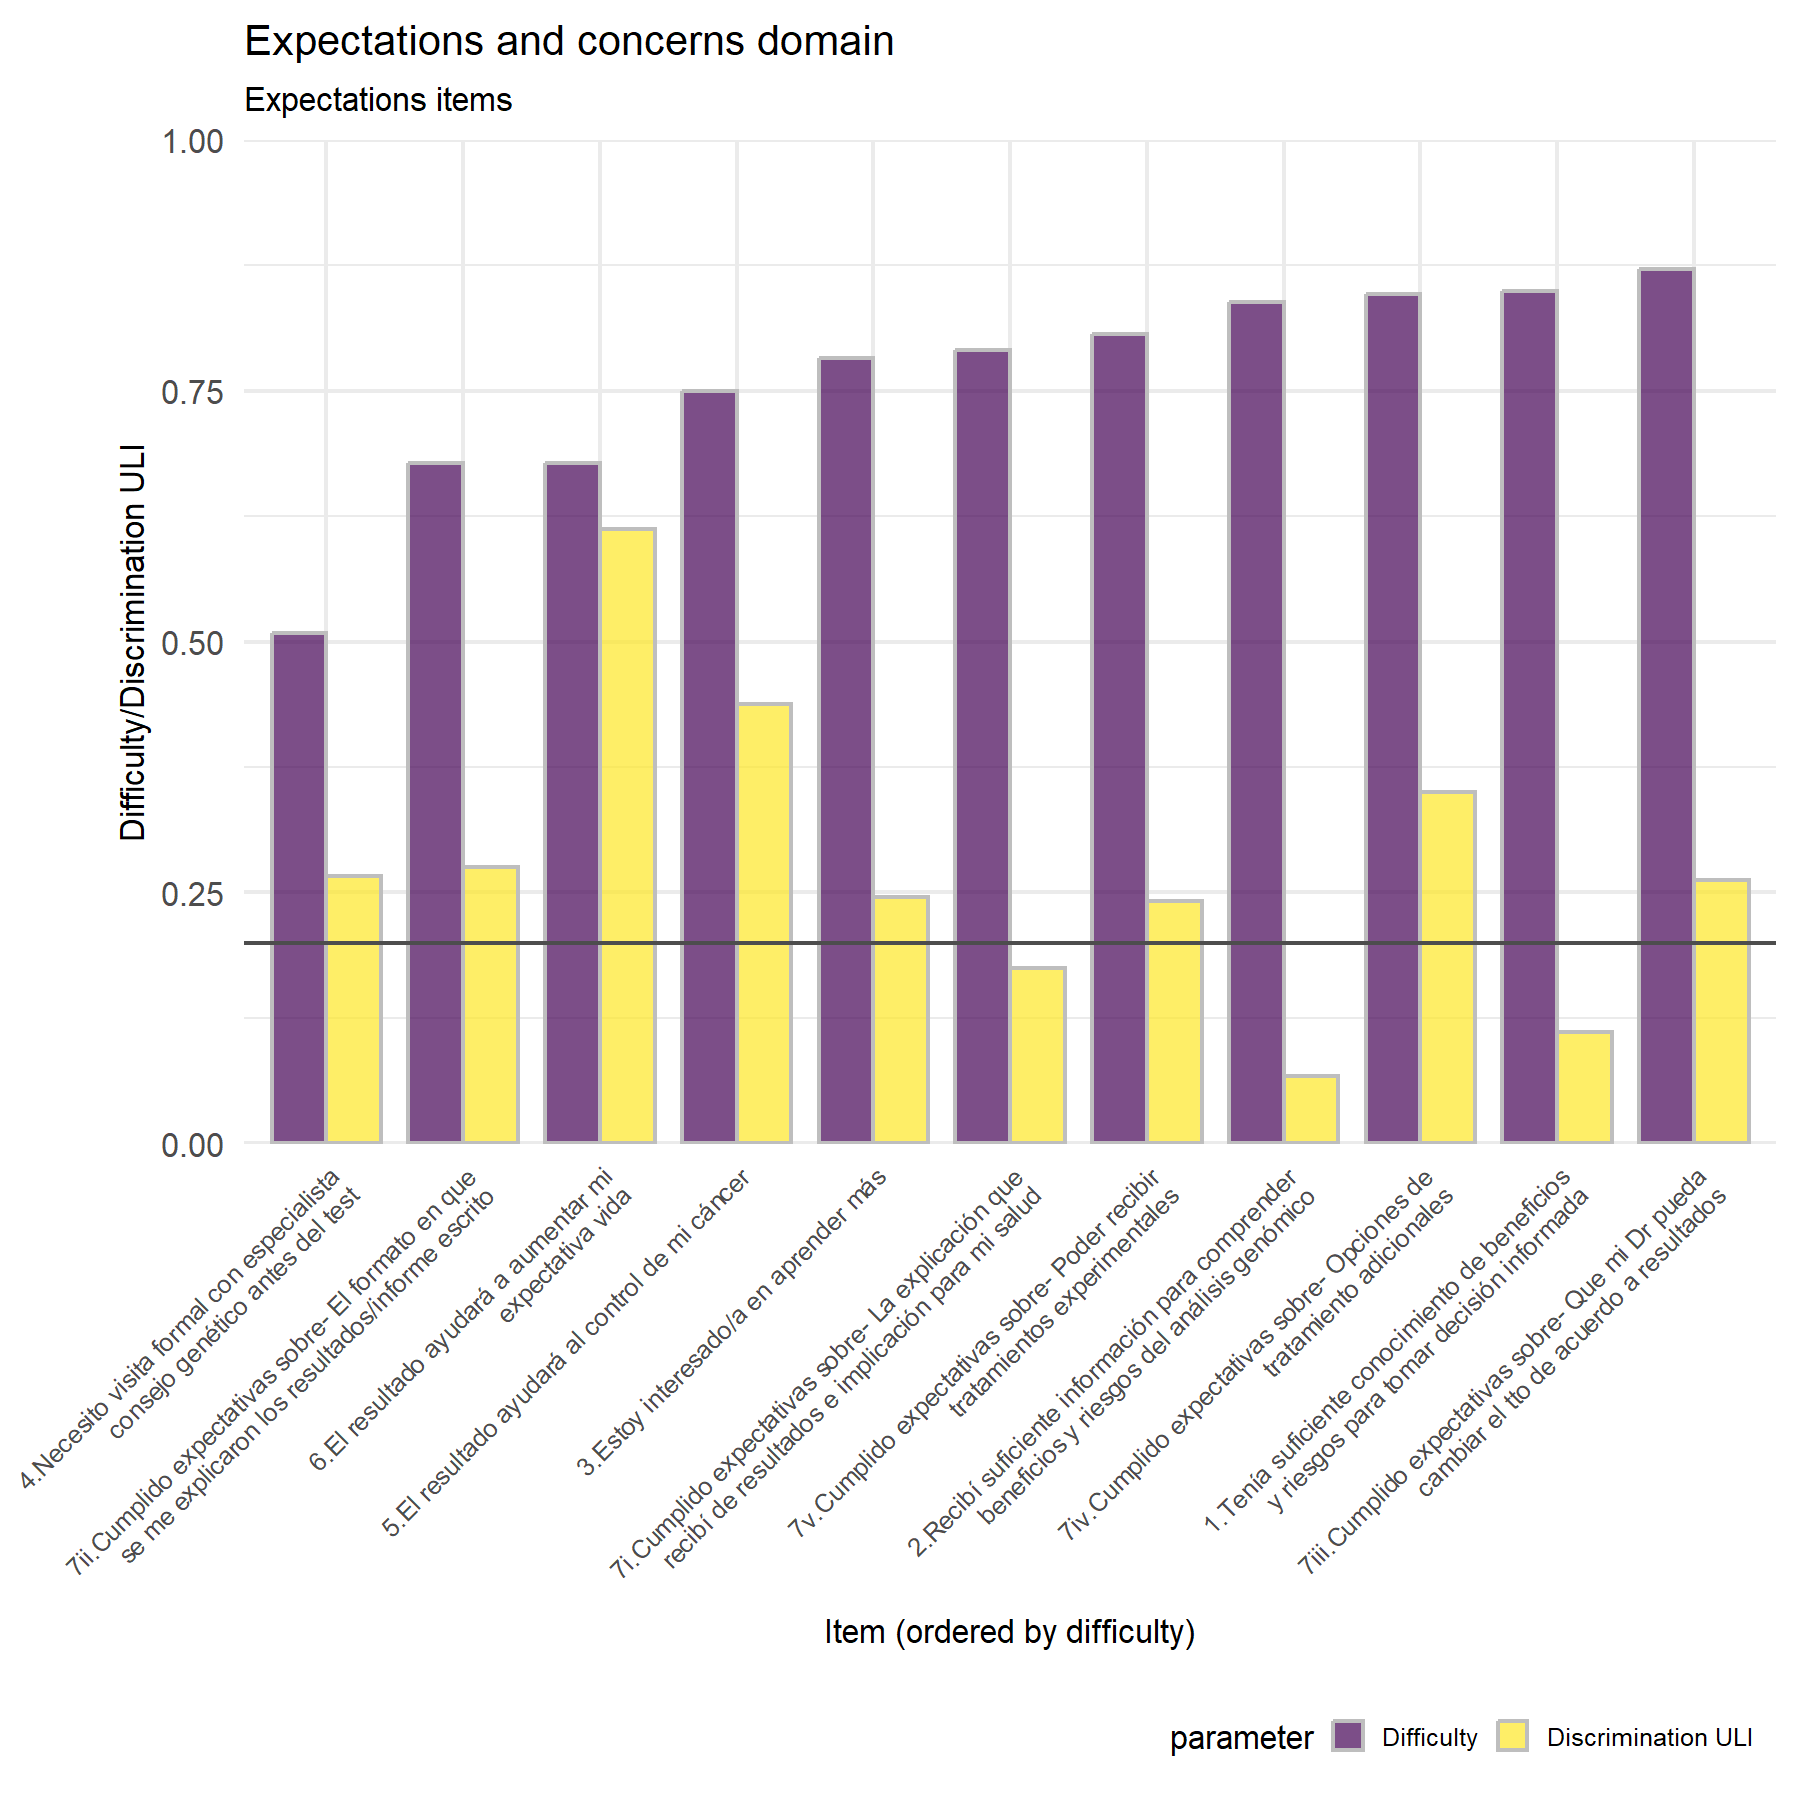
The highest scores for discrimination are shown by items Q6, and Q5. Q2 shows the lower discrimination score. However, most of the items exhibit low scores.
## Scale for fill is already present.
## Adding another scale for fill, which will replace the existing scale.
## Scale for colour is already present.
## Adding another scale for colour, which will replace the existing scale.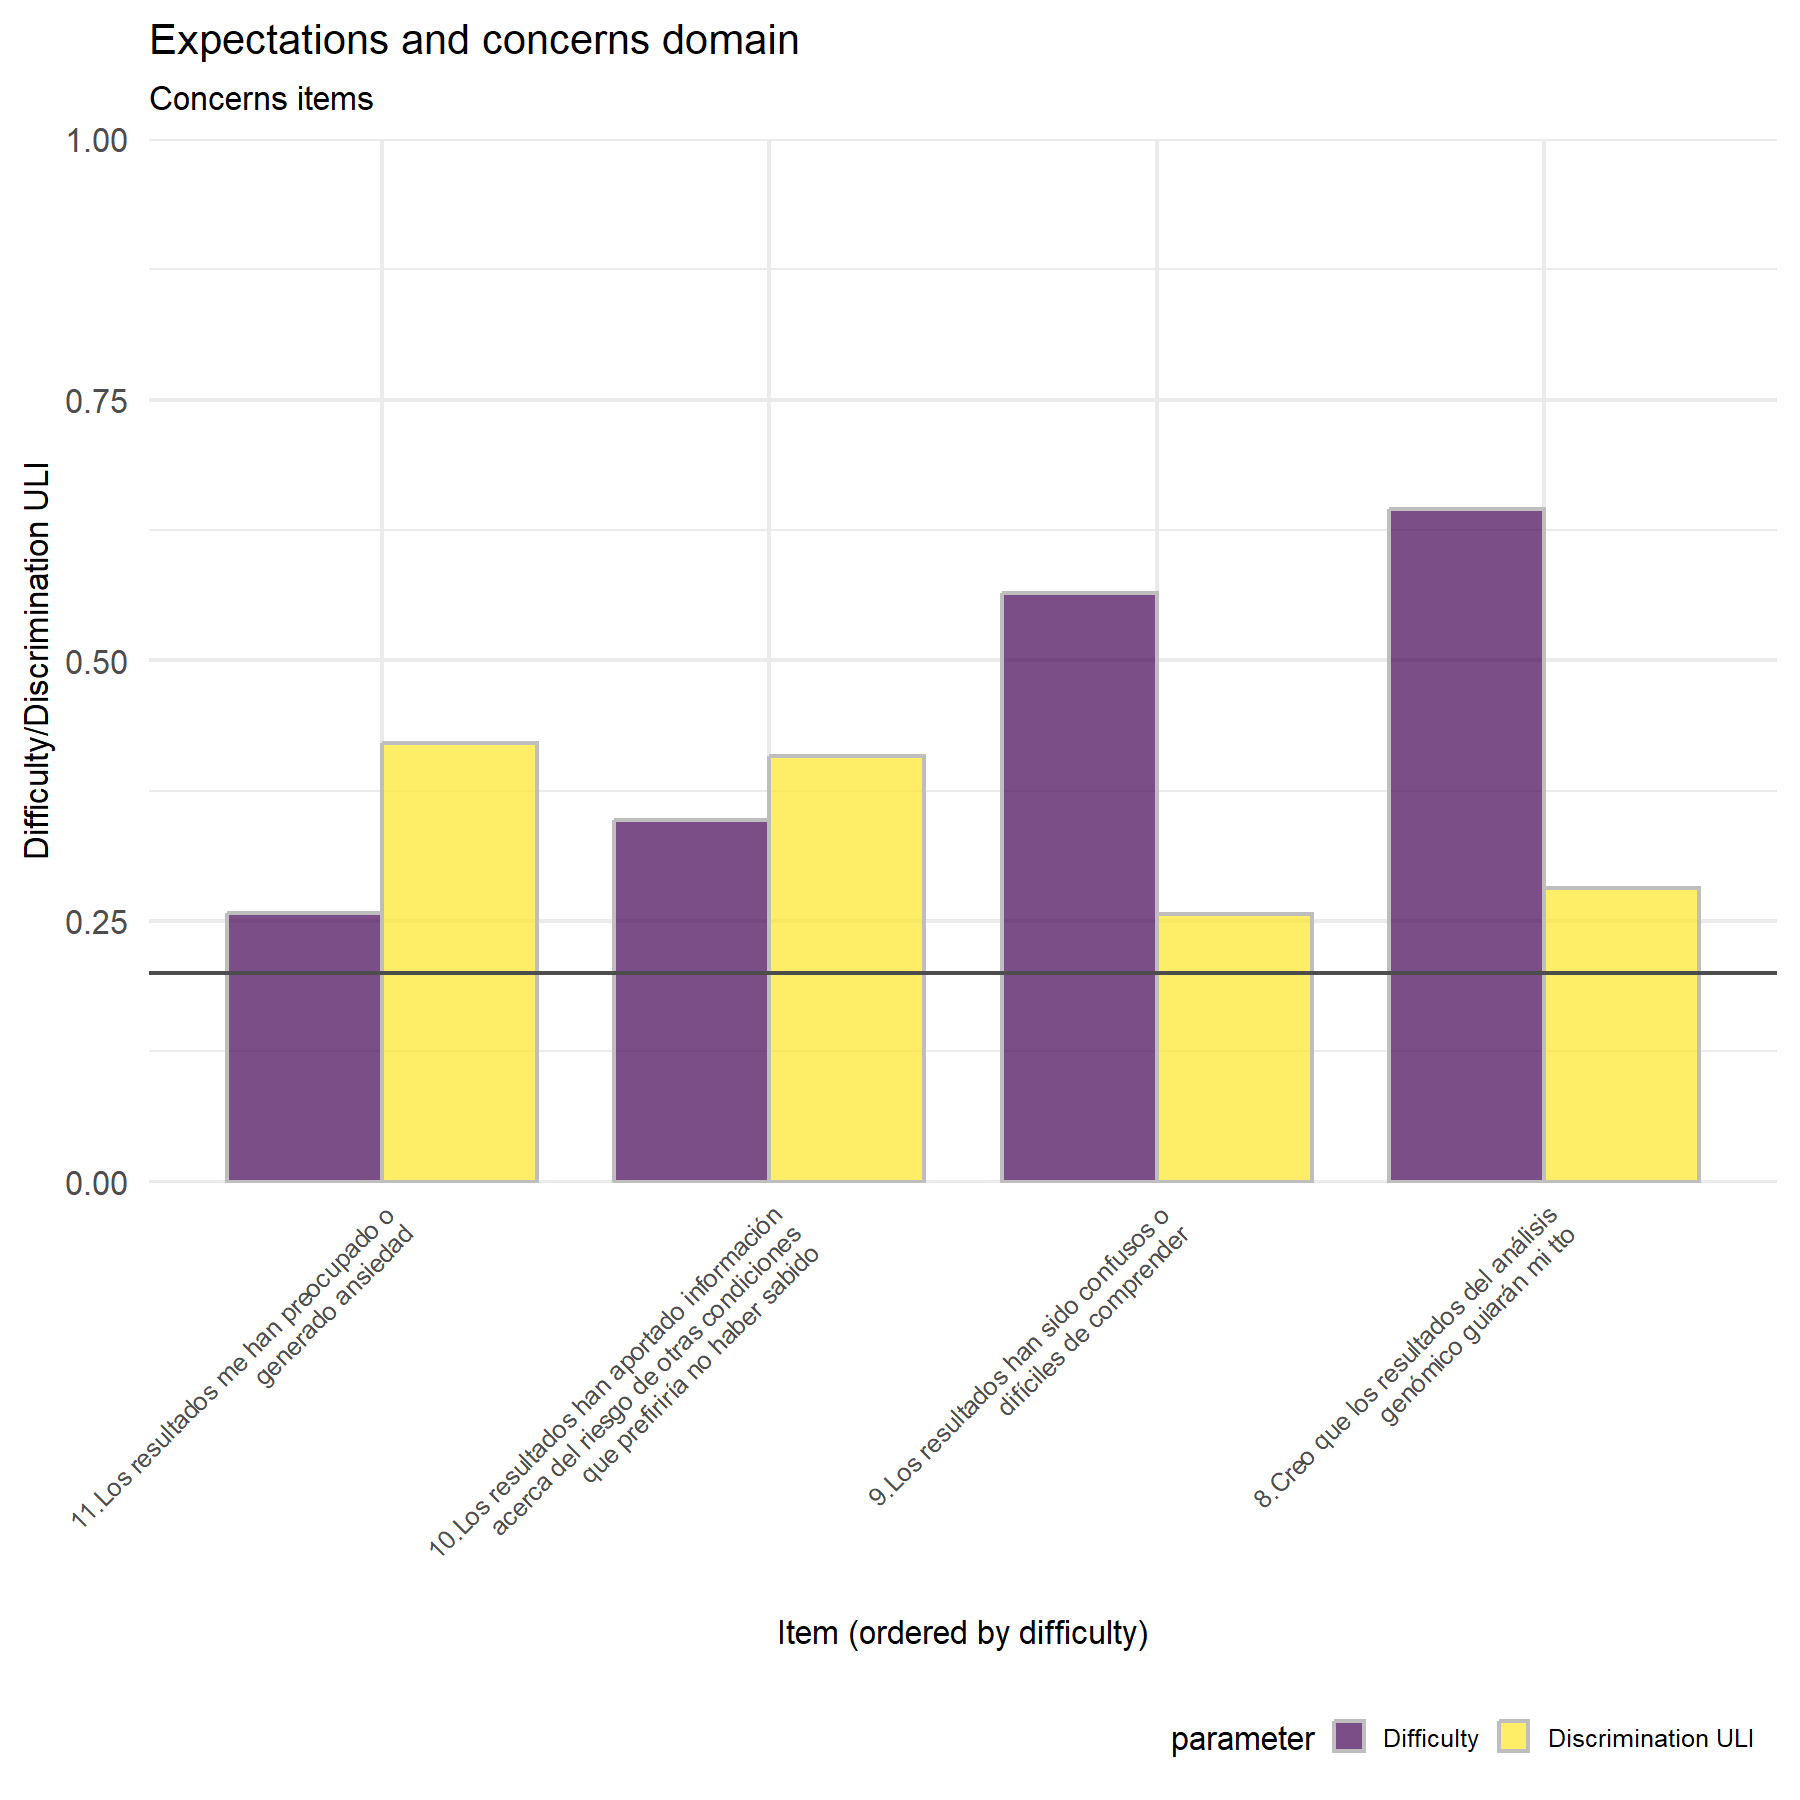
Regarding discrimination and the concerns domain, item 11 shows the highest discrimination score, followed by 10.
Partial conclusion:
Expectations.
Variability- Highest variability: Q6, Q5, Q3, and Q7.v.
Lowest variability: Q7.ii followed by Q2, Q1 and Q7.iii.
Discrimination- Highest discrimination: Q6, and Q5.
Lowest discrimination: Q2, Q1, Q7.i.
summary-
The best elements are: Q6 and Q5.
The worst two: Q2 and Q1.
Concerns.
Variability- All the items have a wide range of variability.
Discrimination- Item Q11 shows the highest discrimination score.
11.2.2 Evaluating the reliability of questions (Cronbach’s α and Omega)
The Cronbach’s α and the Guttman’s lambda_6 (G6) are calculated for expectations and later for concerns.
11.2.2.1 Expectations
Regarding expectations items, the number 4 will be inverted.
First, analyzing the reliability of the whole subset of items, i.e., the consistency of the expectations section several measurements are display: the Cronbach’s α, with its IC, and the omega (ω) coefficient.
##
##    95% confidence boundaries (Feldt)
##  lower alpha upper
##   0.28  0.55  0.74
##
## Information about this analysis:
##
## Dataframe: post_test_Q_Exp_values[, 2:12]
## Items: all
## Observations: 31
## Positive correlations: 32 out of 55 (58%)
##
## Estimates assuming interval level:
##
## Omega (total): 0.82
## Omega (hierarchical): 0.35
## Revelle's omega (total): 0.82
## Greatest Lower Bound (GLB): NA
## Coefficient H: 1
## Coefficient alpha: 0.56
##
## (Estimates assuming ordinal level not computed, as the polychoric correlation matrix has missing values.)
##
## Note: the normal point estimate and confidence interval for omega are based on the procedure suggested by Dunn, Baguley & Brunsden (2013) using the MBESS function ci.reliability, whereas the psych package point estimate was suggested in Revelle & Zinbarg (2008). See the help ('?scaleStructure') for more information.The alpha resulted in a lower value (0.56), however, the omega total is 0.82.
Then, in order to inspect the role of each item, the r.cor, the alpha when the item is dropped, and the Guttman’s Lambda 6 (G6) are explored.
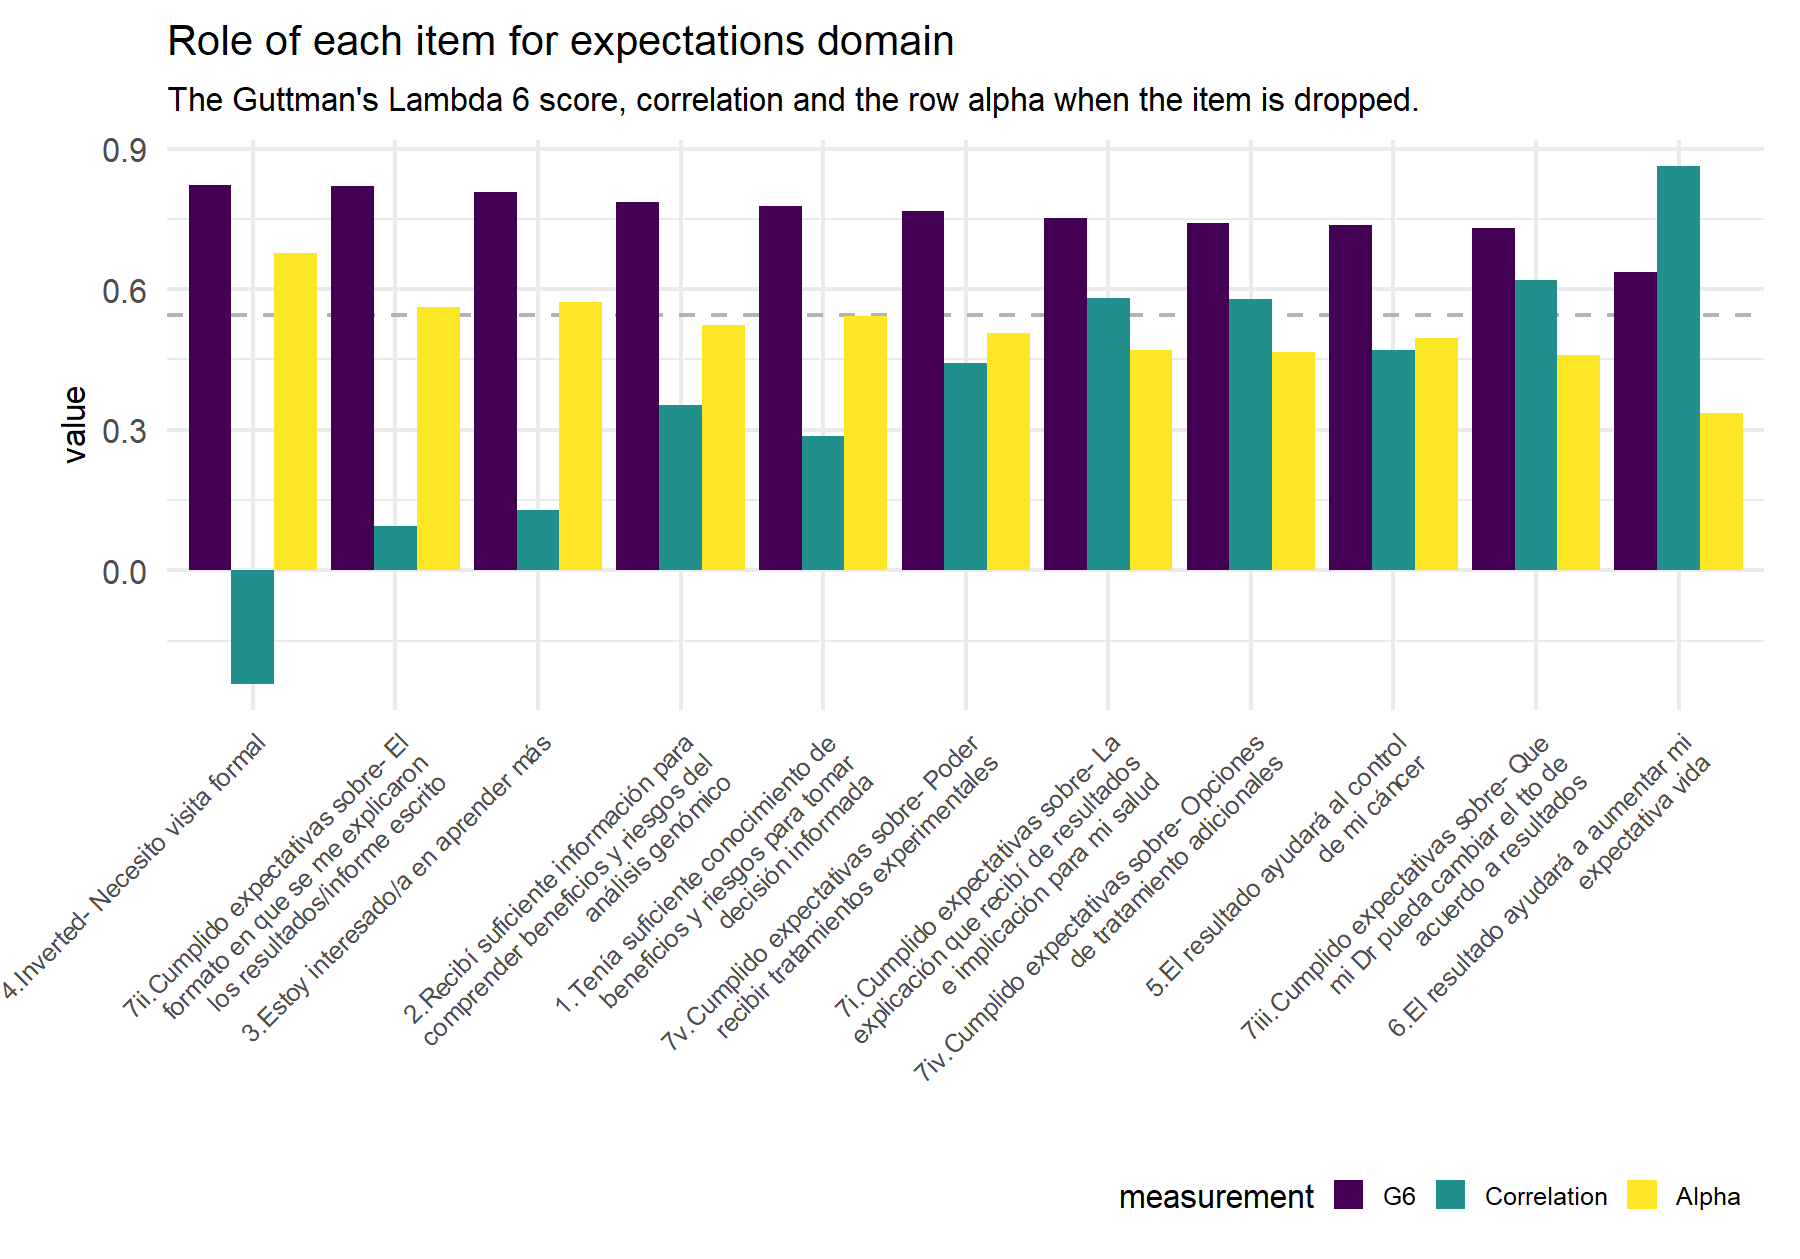
Figure 11.1: Dashed line indicates the alpha (Feldt alpha) value for the whole set of items in order to compare this value if the alpha value that results from dropping the corresponding item (yellow bar).
| Items | G6 | raw_alpha_itemDropped | r.cor |
|---|---|---|---|
| 4.Inverted- Necesito visita formal | 0.8220 | 0.6769 | -0.2424 |
| 7ii.Cumplido expectativas sobre- El formato en que se me explicaron los resultados/informe escrito | 0.8193 | 0.5627 | 0.0943 |
| 3.Estoy interesado/a en aprender más | 0.8064 | 0.5735 | 0.1294 |
| 2.Recibí suficiente información para comprender beneficios y riesgos del análisis genómico | 0.7862 | 0.5247 | 0.3535 |
| 1.Tenía suficiente conocimiento de beneficios y riesgos para tomar decisión informada | 0.7772 | 0.5426 | 0.2873 |
| 7v.Cumplido expectativas sobre- Poder recibir tratamientos experimentales | 0.7678 | 0.5058 | 0.4435 |
| 7i.Cumplido expectativas sobre- La explicación que recibí de resultados e implicación para mi salud | 0.7530 | 0.4700 | 0.5818 |
| 7iv.Cumplido expectativas sobre- Opciones de tratamiento adicionales | 0.7409 | 0.4660 | 0.5793 |
| 5.El resultado ayudará al control de mi cáncer | 0.7380 | 0.4960 | 0.4694 |
| 7iii.Cumplido expectativas sobre- Que mi Dr pueda cambiar el tto de acuerdo a resultados | 0.7304 | 0.4596 | 0.6188 |
| 6.El resultado ayudará a aumentar mi expectativa vida | 0.6367 | 0.3356 | 0.8637 |
As was seen in the pre test questionnaire, items Q4, Q3 and Q7.ii seem to be the less relevant. Here they showed lower correlation values and alpha increases when they are dropped. Then, the best combination between these scores can be seen for items 7.iii, 7.i, 7.iv, 7.v, 6 and 5; being these last ones, those which the highest correlation, lower alpha when the items is dropped, but with lower G6 too.
11.2.2.2 Concerns
Regarding concerns, the last 4 questions are focus on this topic.
First, analyzing the reliability of the whole subset of items, i.e., the consistency of the concerns section several measurements are display: the Cronbach’s α, with its IC, and the omega (ω) coefficient.
##
##    95% confidence boundaries (Feldt)
##  lower alpha upper
##  -0.33  0.22  0.58
##
## Information about this analysis:
##
## Dataframe: post_test_Q_Concerns_values
## Items: all
## Observations: 31
## Positive correlations: 3 out of 6 (50%)
##
## Estimates assuming interval level:
##
## Omega (total): 0.46
## Omega (hierarchical): 0.4
## Revelle's omega (total): 0.46
## Greatest Lower Bound (GLB): NA
## Coefficient H: 0.62
## Coefficient alpha: 0.12
##
## (Estimates assuming ordinal level not computed, as the polychoric correlation matrix has missing values.)
##
## Note: the normal point estimate and confidence interval for omega are based on the procedure suggested by Dunn, Baguley & Brunsden (2013) using the MBESS function ci.reliability, whereas the psych package point estimate was suggested in Revelle & Zinbarg (2008). See the help ('?scaleStructure') for more information.Similar to what was found in the VHIO cohort, alpha and omega scores are extremely low. Then, in order to inspect the role of each item, the r.cor and the Guttman’s Lambda 6 (G6) are explored.
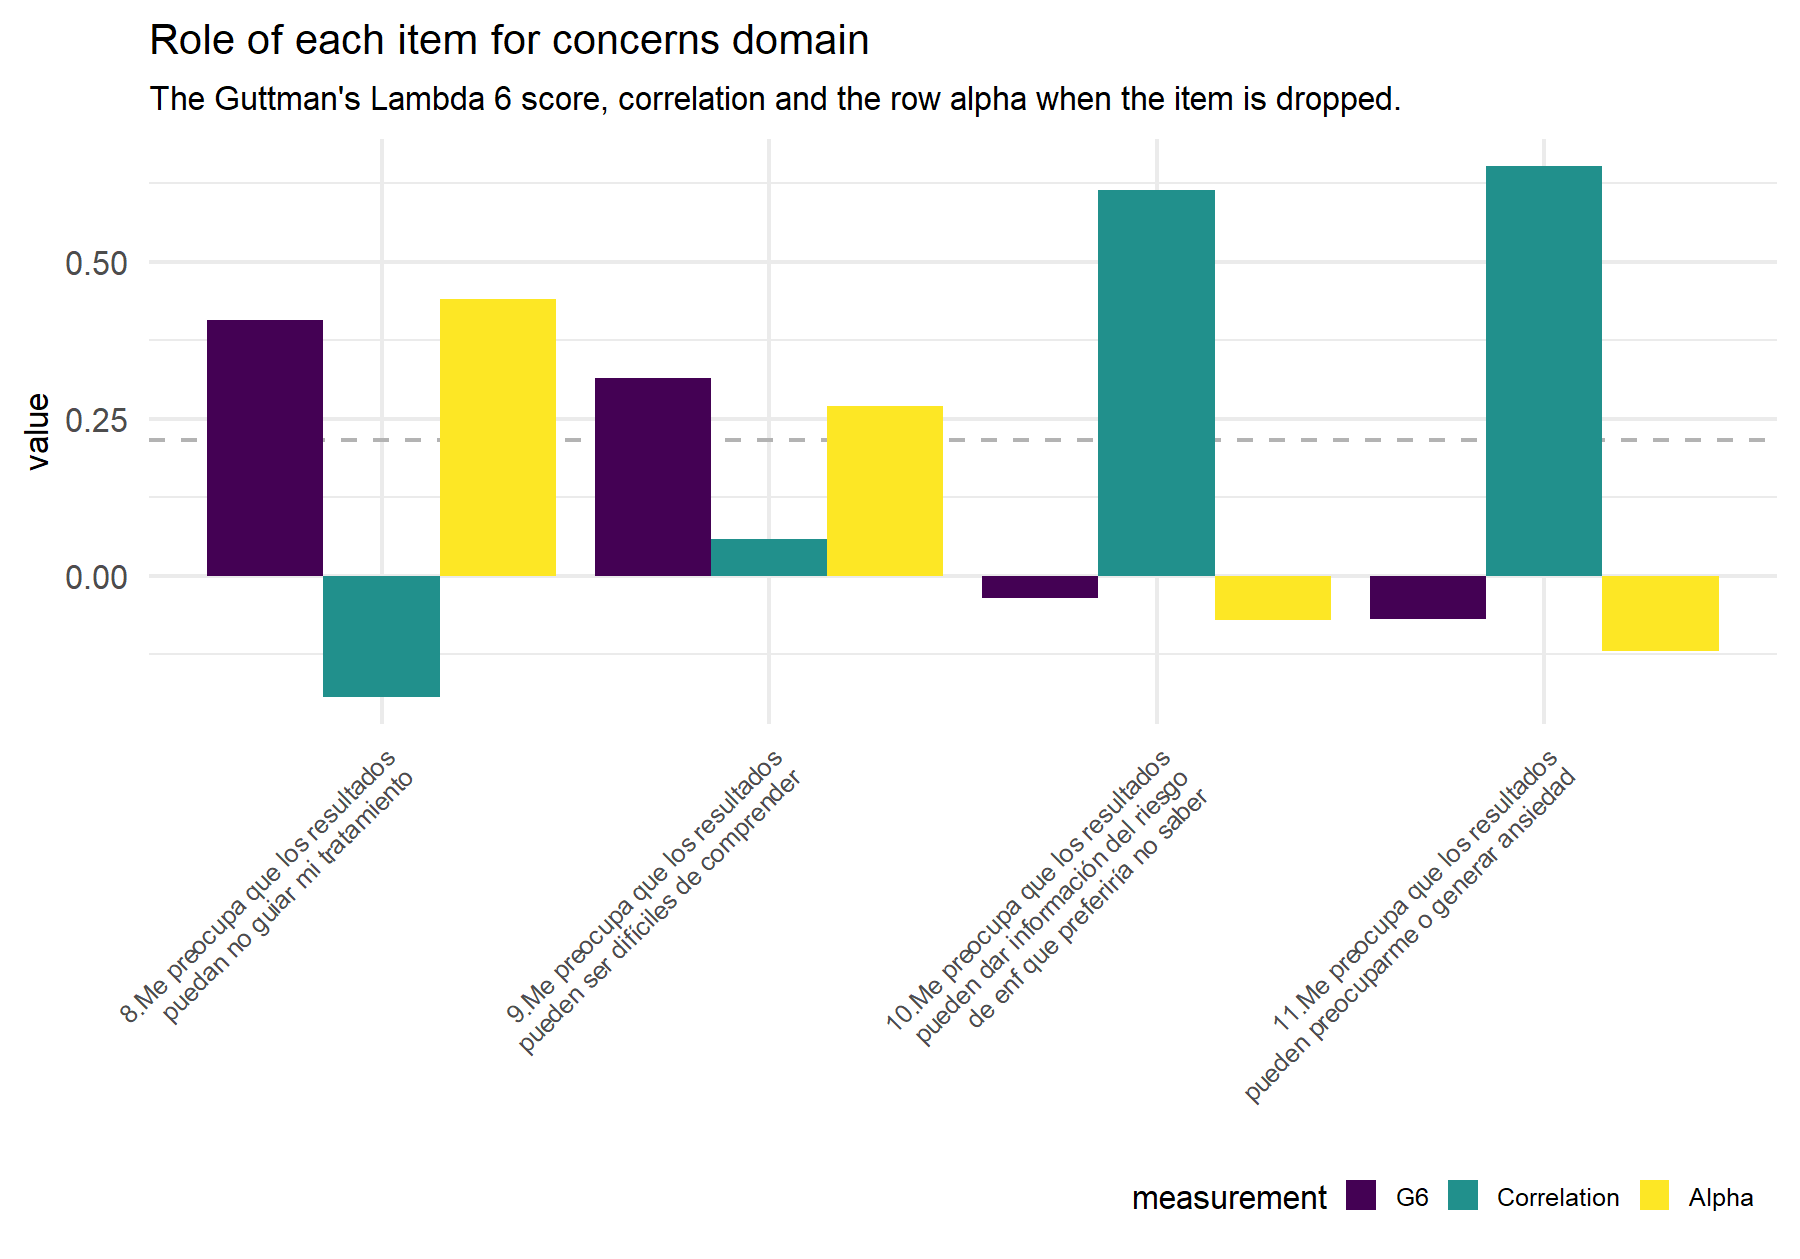
Figure 11.2: Dashed line indicates the alpha (Feldt alpha) value for the whole set of items in order to compare this value if the alpha value that results from dropping the corresponding item (yellow bar).
##                                                                                                              Items
## 1                                                     9.Los resultados han sido confusos o difíciles de comprender
## 2                                                   8.Creo que los resultados del análisis genómico guiarán mi tto
## 3 10.Los resultados han aportado información acerca del riesgo de otras condiciones que prefiriría no haber sabido
## 4                                                          11.Los resultados me han preocupado o generado ansiedad
##         G6 raw_alpha_itemDropped    r.cor
## 1  0.40752               0.44024 -0.19418
## 2  0.31461               0.26927  0.05881
## 3 -0.03577              -0.07082  0.61406
## 4 -0.06902              -0.12017  0.65295
In this setting, while correlation scores are extremely high the G6 are absolutely low. This behavior was not seen before.
11.2.3 Global conclusions about expectations domain
Considering the aim of identifying the final set of items to be used for the next step and the fact that the post test questionnaire has less number of items, it is not expected to define additional items to eliminate after this analysis. The main objective at this step was analysed to explore the behavior and performance of each item, and to determine whether the items selected at the pre-test are still useful in the post-test questionnaire and vice versa.
The results for the post-genomic test are summarized below.
Summary variability and discrimination-
The best elements are: Q6, Q5, and Q7.v.
The worst two: Q2 and Q1. .
Summary G6, correlation, and alpha when the item is dropped-
The best items: Q7.iii, Q7.v, Q7.iv and Q7.i.
The worst items Q3, Q4, and Q7.ii.
Potential items to be excluded according these analysis: Q4, Q3, Q1, and Q7.ii.
Results showed similarities with those from VHIO cohort, and with the pre-test questionnaire.
Regarding concerns, while there is a broad variability that could be useful, the global metrics such as alpha and omega were extremely low, in line with conflicting scores when each items is analyzed (G6, correlation, etc).
11.3 Attitudes domain
This domain includes 5 items, all focused on the attitudes and reliability of the test itself. All the items oriented to the motivations are not included in this stage. Therefore, all these 5 are similar to the previous ones in the pre-test questionnaire with a Likert scale.
11.3.1 Visualizing items and responses
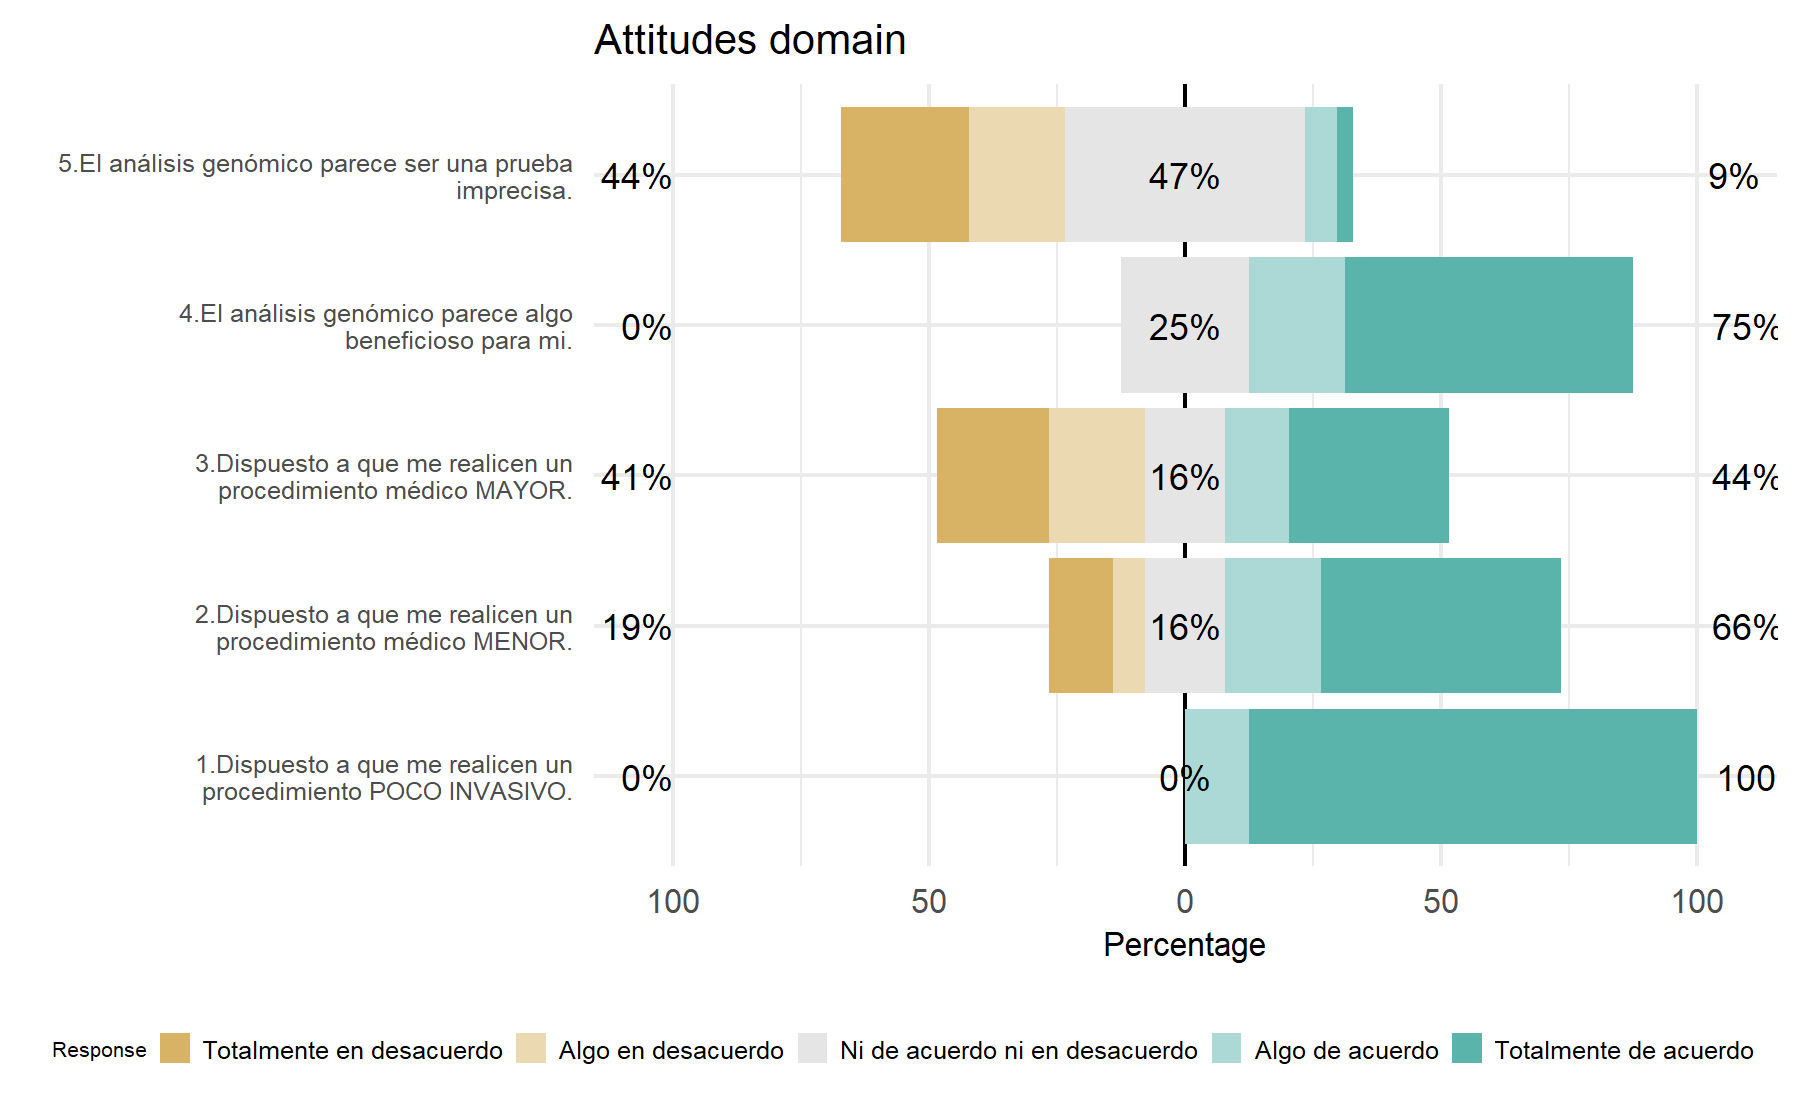
Analyzing the variability between answers, items 4 and 1 show the lowest variability. For the remaining items there are considerable answer´s variability. Besides, the results’ pattern are similar to those found in VHIO cohort.
Secondly, the difficulty and discrimination capacity is evaluated for each of these items.
## Scale for fill is already present.
## Adding another scale for fill, which will replace the existing scale.
## Scale for colour is already present.
## Adding another scale for colour, which will replace the existing scale.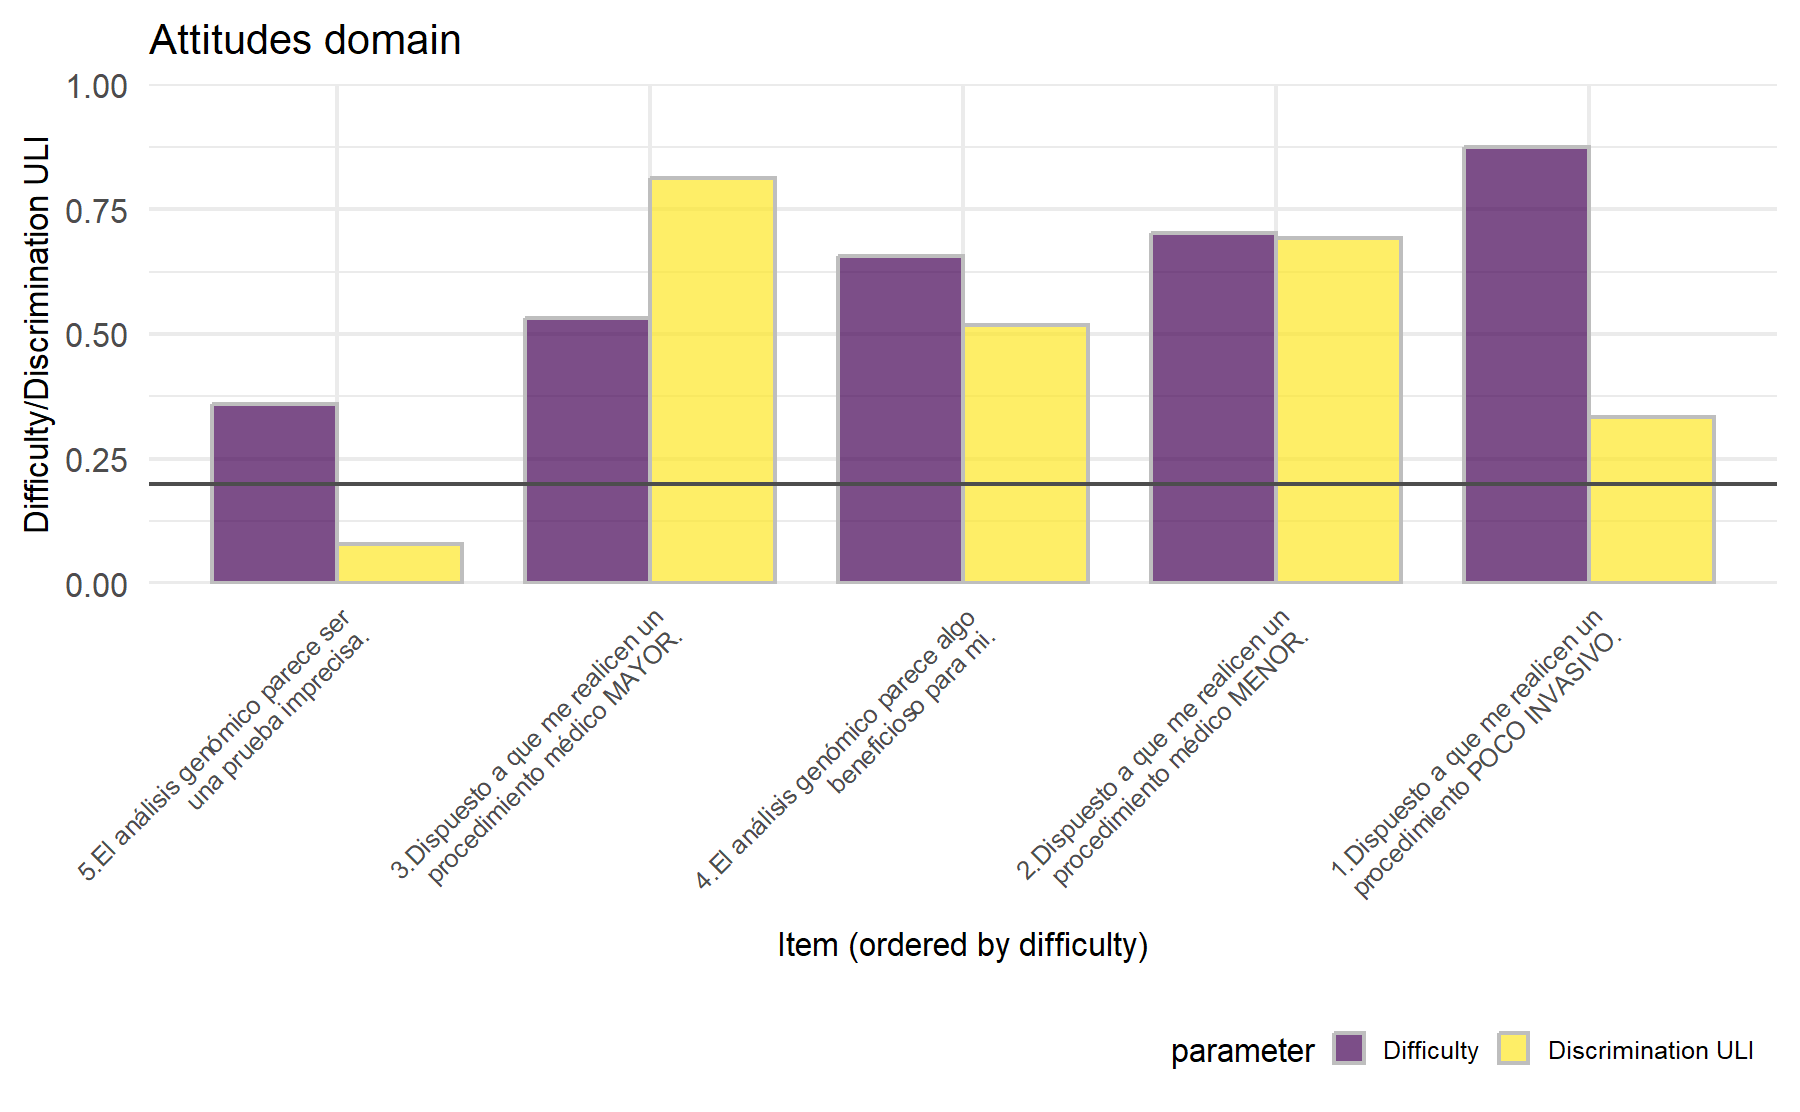
While Q5 has not a negative discrimination value as in VHIO cohort, this item has even a low value.
Partial conclusion:
According to these results, Q5 showed the worst discrimination score. However, it has high variability. Moreover, item Q1 will be finally excluded from the questionnaire.
11.3.2 Evaluating the reliability of questions (Cronbach’s α and Omega)
The Cronbach’s α and the Guttman’s lambda_6 (G6) are calculated for the attitude domain.
##
##    95% confidence boundaries (Feldt)
##  lower alpha upper
##   0.29  0.57  0.77
##
## Information about this analysis:
##
## Dataframe: post_test_Q_Actitd_values[, 2:6]
## Items: all
## Observations: 32
## Positive correlations: 9 out of 10 (90%)
##
## Estimates assuming interval level:
##
## Omega (total): 0.73
## Omega (hierarchical): 0.42
## Revelle's omega (total): 0.73
## Greatest Lower Bound (GLB): NA
## Coefficient H: 1
## Coefficient alpha: 0.57
##
## (Estimates assuming ordinal level not computed, as the polychoric correlation matrix has missing values.)
##
## Note: the normal point estimate and confidence interval for omega are based on the procedure suggested by Dunn, Baguley & Brunsden (2013) using the MBESS function ci.reliability, whereas the psych package point estimate was suggested in Revelle & Zinbarg (2008). See the help ('?scaleStructure') for more information.Alpha and omega did not show high values.
Then, in order to inspect the role of each item, the r.cor and the Guttman’s Lambda 6 (G6) are explored.
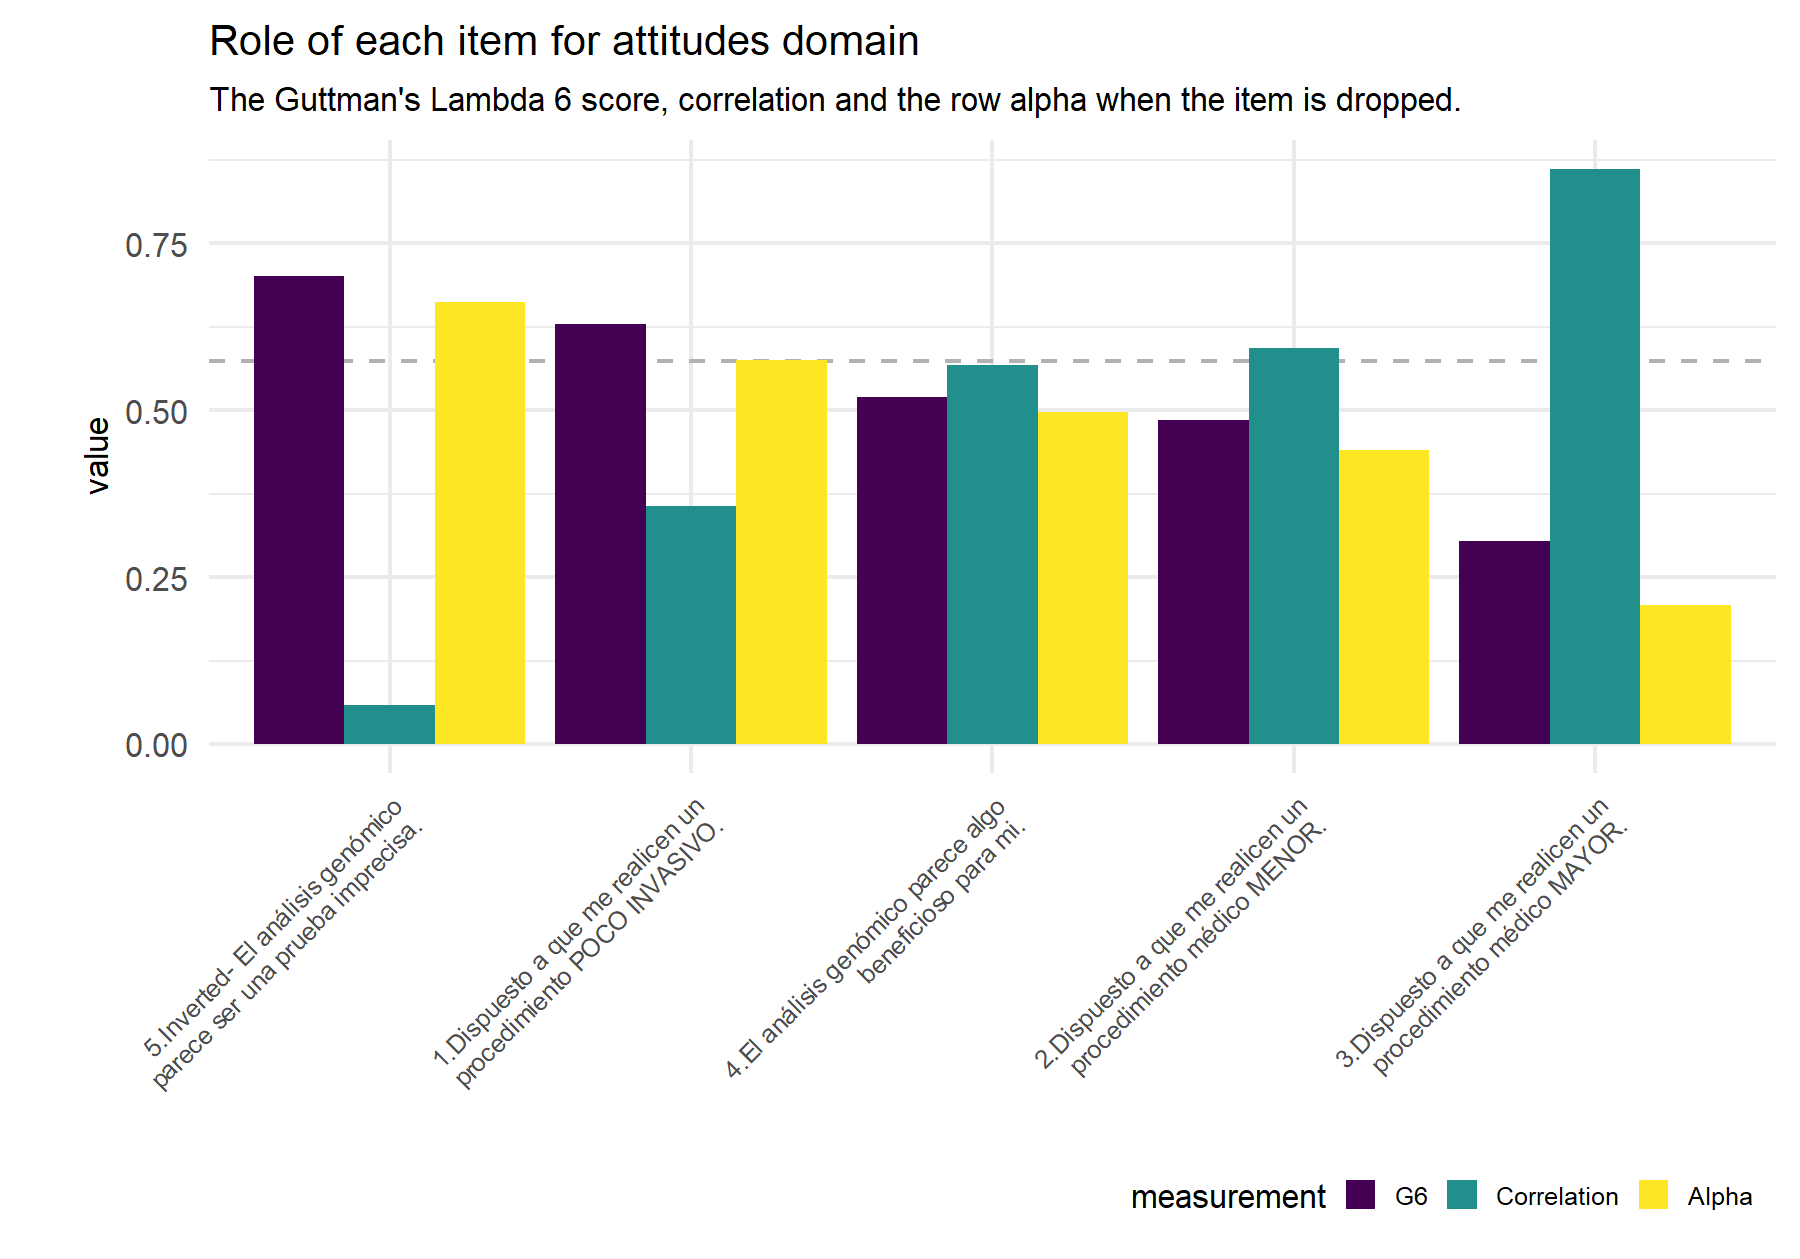
Figure 11.3: Dashed line indicates the alpha (Feldt alpha) value for the whole set of items in order to compare this value if the alpha value that results from dropping the corresponding item (yellow bar).
| Items | G6 | raw_alpha_itemDropped | r.cor |
|---|---|---|---|
| 5.Inverted- El análisis genómico parece ser una prueba imprecisa. | 0.7006 | 0.6626 | 0.0583 |
| 1.Dispuesto a que me realicen un procedimiento POCO INVASIVO. | 0.6297 | 0.5756 | 0.3562 |
| 4.El análisis genómico parece algo beneficioso para mi. | 0.5203 | 0.4974 | 0.5680 |
| 2.Dispuesto a que me realicen un procedimiento médico MENOR. | 0.4855 | 0.4396 | 0.5925 |
| 3.Dispuesto a que me realicen un procedimiento médico MAYOR. | 0.3041 | 0.2079 | 0.8618 |
Partial conclusion: G6 and correlation- In this domain, results are different depending where the focus is posed. While Q3 and Q2 have the best correlation (highest) and alpha values (lowest), they show the lowest G6. Besides, items 4 and 5 show the opposite behavior. These results were similar to those observed in the VHIO cohort.
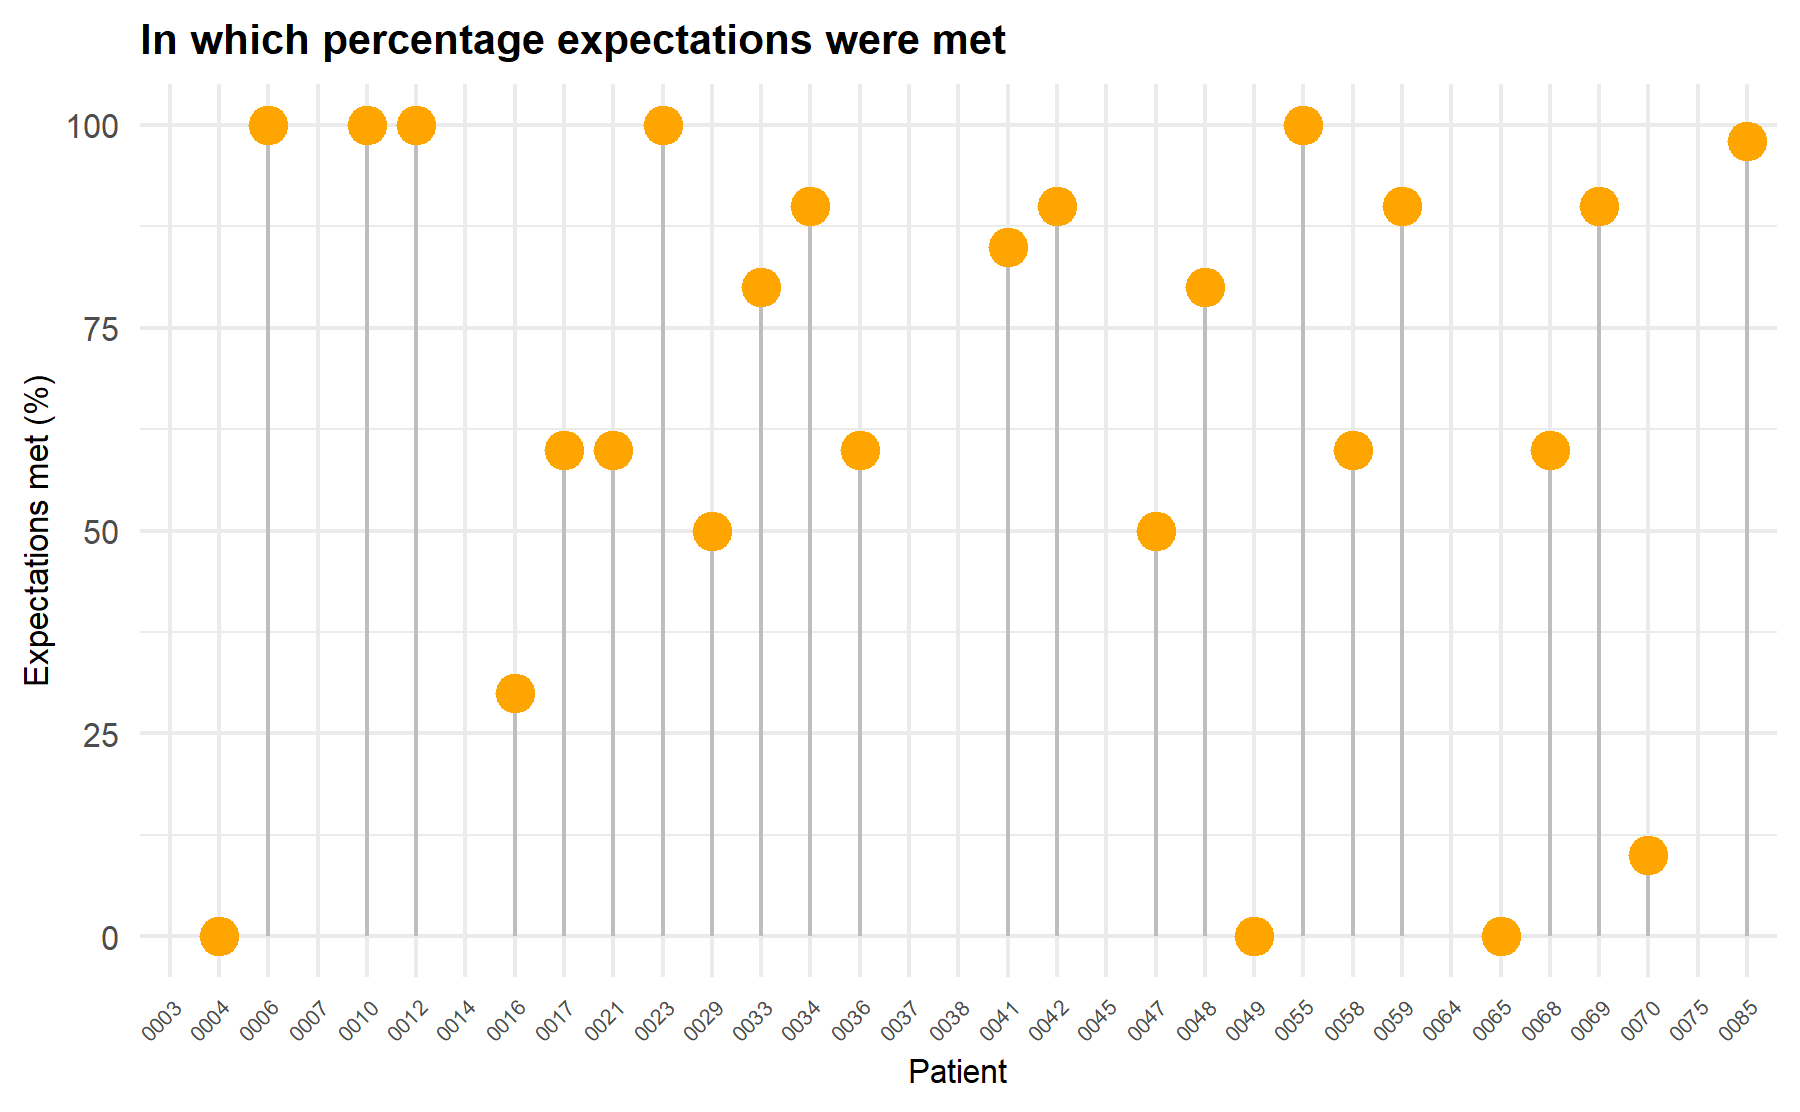
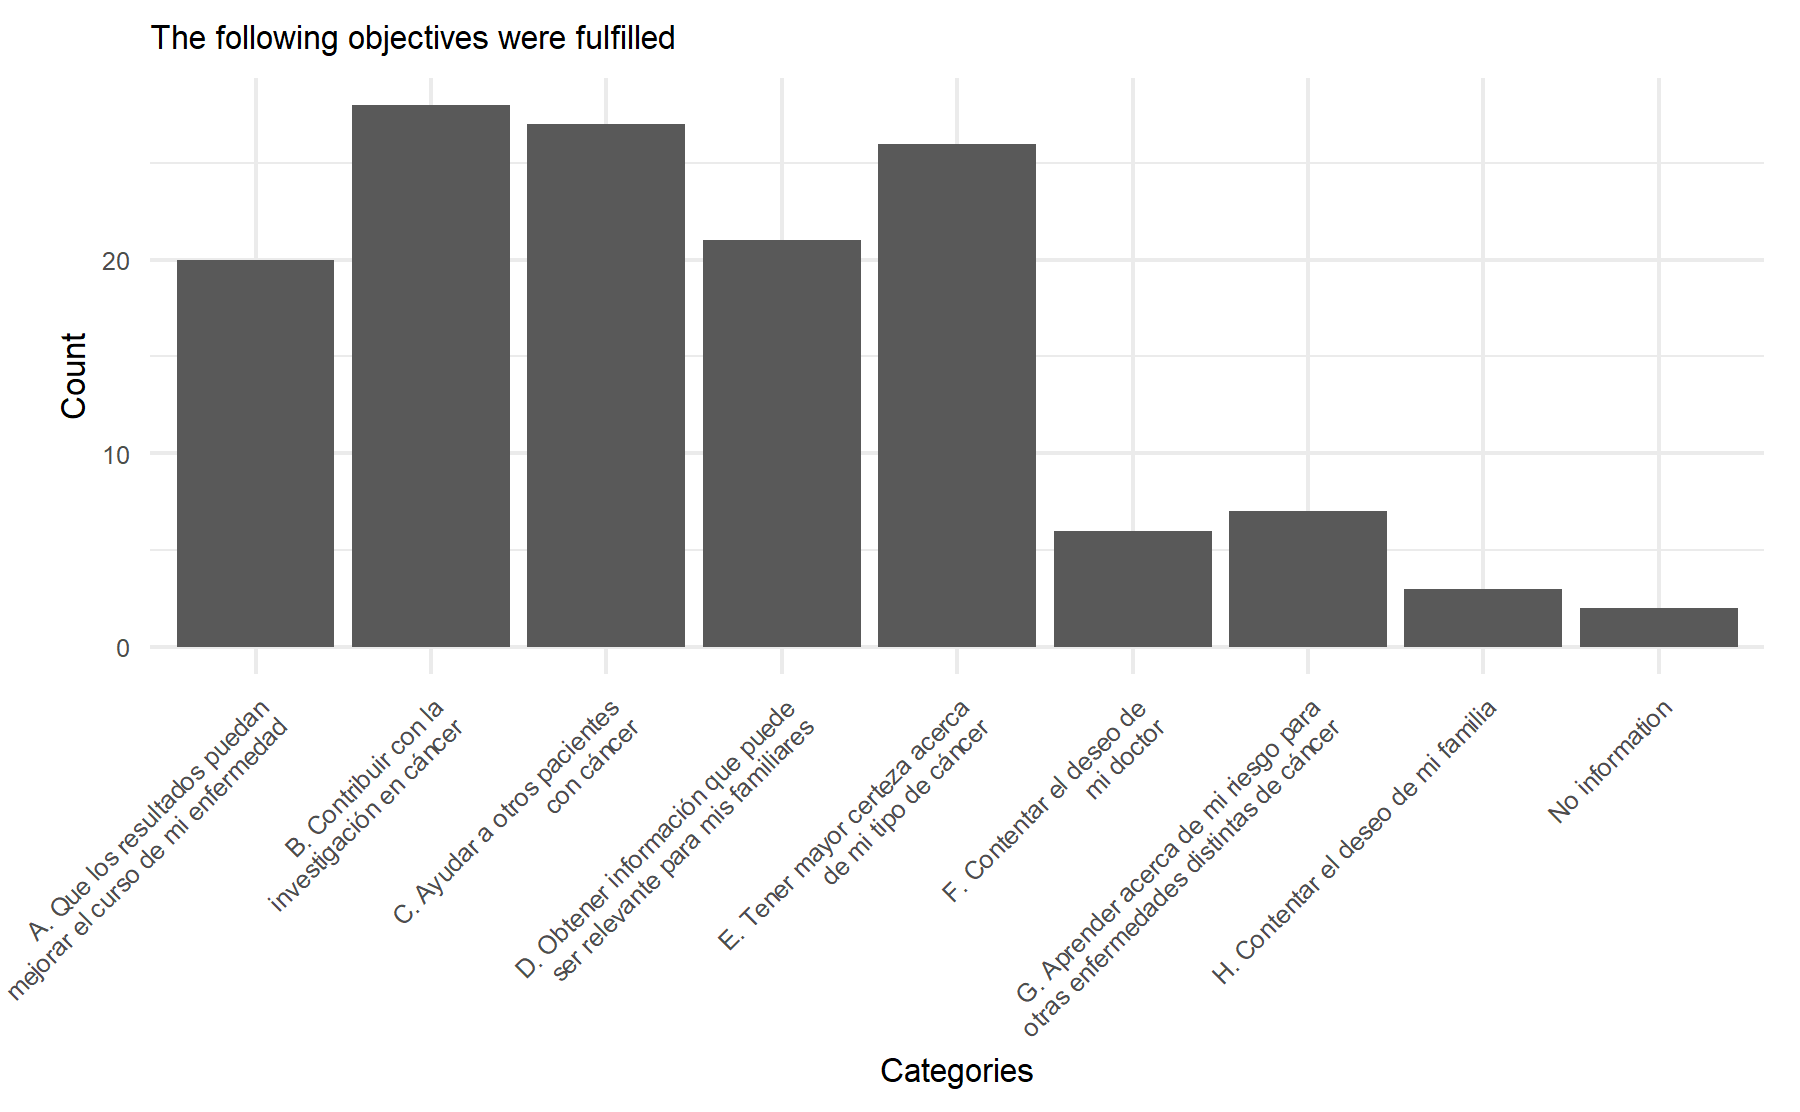
11.4 Expectations’ fulfillment
In this final step, the accomplishment of expectations is described through two additional items. The first one, a multiple choice question; and the second one, a Visual Analogue Scale.
The first item asked about which of the following personal objectives the patient fulfilled after this process. For this item, patients can select more than one option.
Then, the results from the Visual Analogue Scale tool are depicted.
| n | missing | Minimun | Maximun | Mean | DS | Median | FirstQ | ThirdQ | IQR |
|---|---|---|---|---|---|---|---|---|---|
| 33 | 8 | 0 | 100 | 65.72 | 34.19 | 80 | 50 | 90 | 40 |
## Warning: Removed 8 rows containing non-finite values (`stat_bin()`).